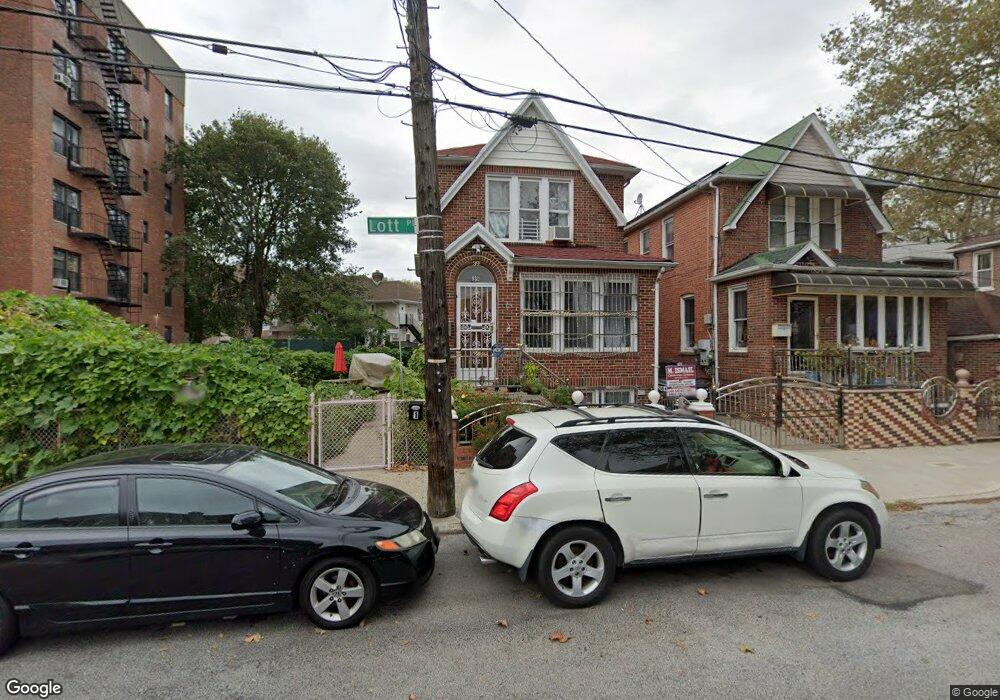
39 Lott Place Unit 1 Brooklyn, NY 11234
Flatlands NeighborhoodEstimated Value: $715,000 - $936,000
2
Beds
1
Bath
1,890
Sq Ft
$427/Sq Ft
Est. Value
About This Home
This home is located at 39 Lott Place Unit 1, Brooklyn, NY 11234 and is currently estimated at $806,345, approximately $426 per square foot. 39 Lott Place Unit 1 is a home located in Kings County with nearby schools including P.S. 119 Amersfort, Andries Hudde School, and Midwood Catholic Academy.
Ownership History
Date
Name
Owned For
Owner Type
Purchase Details
Closed on
Aug 13, 2021
Sold by
Nasrin Ismail and Nasrin Shamima
Bought by
Nasrin Ismail and Nasrin Shamima
Current Estimated Value
Purchase Details
Closed on
Oct 19, 2017
Sold by
Reoco Inc
Bought by
Ismail
Home Financials for this Owner
Home Financials are based on the most recent Mortgage that was taken out on this home.
Original Mortgage
$476,000
Outstanding Balance
$397,914
Interest Rate
3.85%
Mortgage Type
New Conventional
Estimated Equity
$408,432
Purchase Details
Closed on
Apr 12, 2011
Sold by
Emc Mortgage Corporation
Bought by
Reoco Inc
Purchase Details
Closed on
Jan 8, 2009
Sold by
Henry Achiron Esq Referee
Bought by
Emc Mortgage Corporation
Purchase Details
Closed on
Jul 12, 2002
Sold by
Walker Claudet and Walker-Fennell Claudet
Bought by
Hamilton Helene
Home Financials for this Owner
Home Financials are based on the most recent Mortgage that was taken out on this home.
Original Mortgage
$361,000
Interest Rate
6.61%
Mortgage Type
Purchase Money Mortgage
Create a Home Valuation Report for This Property
The Home Valuation Report is an in-depth analysis detailing your home's value as well as a comparison with similar homes in the area
Home Values in the Area
Average Home Value in this Area
Purchase History
| Date | Buyer | Sale Price | Title Company |
|---|---|---|---|
| Nasrin Ismail | -- | -- | |
| Ismail | $595,000 | -- | |
| Reoco Inc | -- | -- | |
| Emc Mortgage Corporation | $517,914 | -- | |
| Hamilton Helene | -- | -- |
Source: Public Records
Mortgage History
| Date | Status | Borrower | Loan Amount |
|---|---|---|---|
| Open | Ismail | $476,000 | |
| Previous Owner | Hamilton Helene | $361,000 |
Source: Public Records
Tax History
| Year | Tax Paid | Tax Assessment Tax Assessment Total Assessment is a certain percentage of the fair market value that is determined by local assessors to be the total taxable value of land and additions on the property. | Land | Improvement |
|---|---|---|---|---|
| 2025 | $8,884 | $40,980 | $17,520 | $23,460 |
| 2024 | $8,884 | $48,180 | $17,520 | $30,660 |
| 2023 | $8,475 | $49,740 | $17,520 | $32,220 |
| 2022 | $7,859 | $46,080 | $17,520 | $28,560 |
| 2021 | $7,816 | $37,140 | $17,520 | $19,620 |
| 2020 | $3,898 | $46,140 | $17,520 | $28,620 |
| 2019 | $7,733 | $46,140 | $17,520 | $28,620 |
| 2018 | $7,109 | $34,873 | $16,087 | $18,786 |
| 2017 | $6,707 | $32,901 | $14,025 | $18,876 |
| 2016 | $6,208 | $31,053 | $15,880 | $15,173 |
| 2015 | $3,744 | $31,053 | $12,807 | $18,246 |
| 2014 | $3,744 | $30,804 | $13,187 | $17,617 |
Source: Public Records
Map
Nearby Homes
- 2020 E 41st St Unit 2B
- 2117 Troy Ave
- 4409 Avenue M
- 4306 Avenue M
- 1573 E 45th St
- 1492 E 45th St
- 4042 Hubbard Place
- 4032 Hubbard Place
- 1568 E 46th St
- 4115 Hubbard Place
- 1345 E 38th St
- 1563 E 46th St
- 1638 E 45th St
- 1642 E 45th St
- 2075 Flatbush Ave
- 2230 Troy Ave
- 4019 Avenue K
- 1173 E 43rd St
- 2037 Schenectady Ave
- 1513 Kimball St
- 39 Lott Place
- 47 Lott Place
- 3916 Kings Hwy
- 1342 E 40th St
- 1344 E 40th St
- 1340 E 40th St
- 1336 E 40th St
- 1 Harden St
- 1334 E 40th St
- 1332 E 40th St
- 3900 Kings Hwy
- 3900 Kings Hwy Unit 5-J
- 3900 Kings Hwy Unit 2d
- 3900 Kings Hwy Unit d2
- 3900 Kings Hwy Unit 3c
- 3900 Kings Hwy Unit 3p
- 3900 Kings Hwy Unit 3l
- 3900 Kings Hwy Unit 4l
- 3900 Kings Hwy Unit 4l
- 3900 Kings Hwy Unit 5b
Your Personal Tour Guide
Ask me questions while you tour the home.