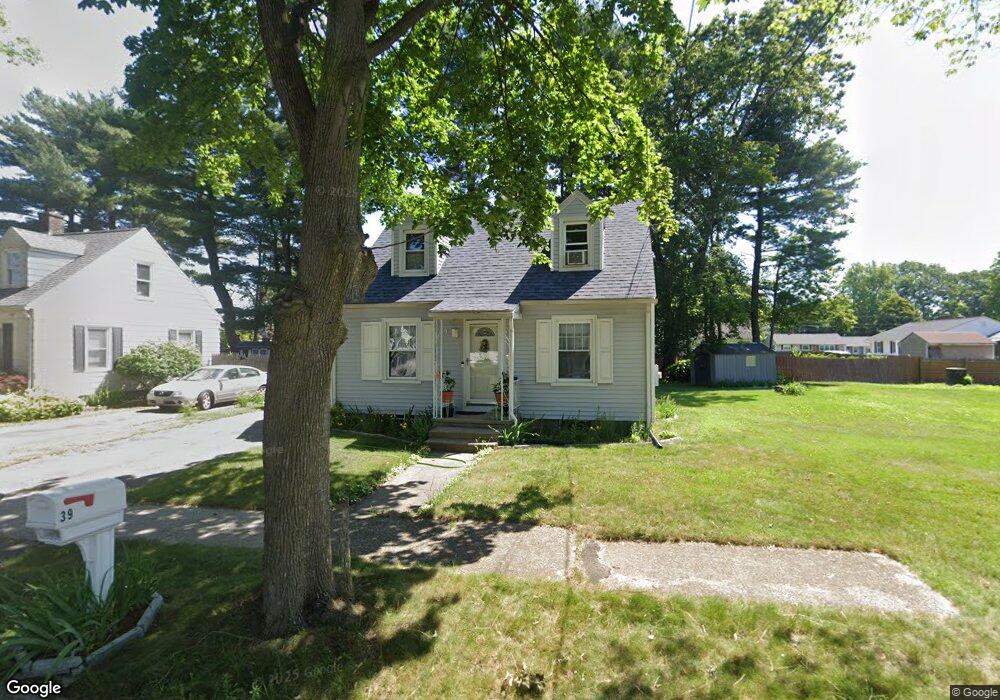
39 Lucerne Rd Springfield, MA 01119
Boston Road NeighborhoodEstimated Value: $259,000 - $328,000
2
Beds
1
Bath
1,064
Sq Ft
$265/Sq Ft
Est. Value
About This Home
This home is located at 39 Lucerne Rd, Springfield, MA 01119 and is currently estimated at $282,460, approximately $265 per square foot. 39 Lucerne Rd is a home located in Hampden County with nearby schools including Warner, M Marcus Kiley Middle, and Springfield Central High School.
Ownership History
Date
Name
Owned For
Owner Type
Purchase Details
Closed on
May 5, 2003
Sold by
Forni M D and Forni Michael D
Bought by
Lozada Carmen Z and Martin Steven C
Current Estimated Value
Home Financials for this Owner
Home Financials are based on the most recent Mortgage that was taken out on this home.
Original Mortgage
$102,000
Interest Rate
5.82%
Mortgage Type
Purchase Money Mortgage
Purchase Details
Closed on
Dec 3, 2002
Sold by
Ayotte Robert A and Ayotte-Lang Susan
Bought by
Forni Michael
Home Financials for this Owner
Home Financials are based on the most recent Mortgage that was taken out on this home.
Original Mortgage
$49,000
Interest Rate
6.16%
Mortgage Type
Purchase Money Mortgage
Create a Home Valuation Report for This Property
The Home Valuation Report is an in-depth analysis detailing your home's value as well as a comparison with similar homes in the area
Home Values in the Area
Average Home Value in this Area
Purchase History
| Date | Buyer | Sale Price | Title Company |
|---|---|---|---|
| Lozada Carmen Z | $102,000 | -- | |
| Forni Michael | $61,900 | -- |
Source: Public Records
Mortgage History
| Date | Status | Borrower | Loan Amount |
|---|---|---|---|
| Open | Forni Michael | $110,398 | |
| Closed | Lozada Carmen Z | $102,000 | |
| Previous Owner | Forni Michael | $49,000 |
Source: Public Records
Tax History
| Year | Tax Paid | Tax Assessment Tax Assessment Total Assessment is a certain percentage of the fair market value that is determined by local assessors to be the total taxable value of land and additions on the property. | Land | Improvement |
|---|---|---|---|---|
| 2025 | $3,605 | $229,900 | $45,000 | $184,900 |
| 2024 | $3,014 | $187,700 | $42,100 | $145,600 |
| 2023 | $3,372 | $197,800 | $40,100 | $157,700 |
| 2022 | $2,915 | $154,900 | $40,100 | $114,800 |
| 2021 | $2,654 | $140,400 | $36,500 | $103,900 |
| 2020 | $2,459 | $125,900 | $36,500 | $89,400 |
| 2019 | $2,430 | $123,500 | $36,500 | $87,000 |
| 2018 | $2,472 | $125,600 | $36,500 | $89,100 |
| 2017 | $2,501 | $127,200 | $36,500 | $90,700 |
| 2016 | $2,410 | $122,600 | $36,500 | $86,100 |
| 2015 | $2,307 | $117,300 | $36,500 | $80,800 |
Source: Public Records
Map
Nearby Homes
Your Personal Tour Guide
Ask me questions while you tour the home.