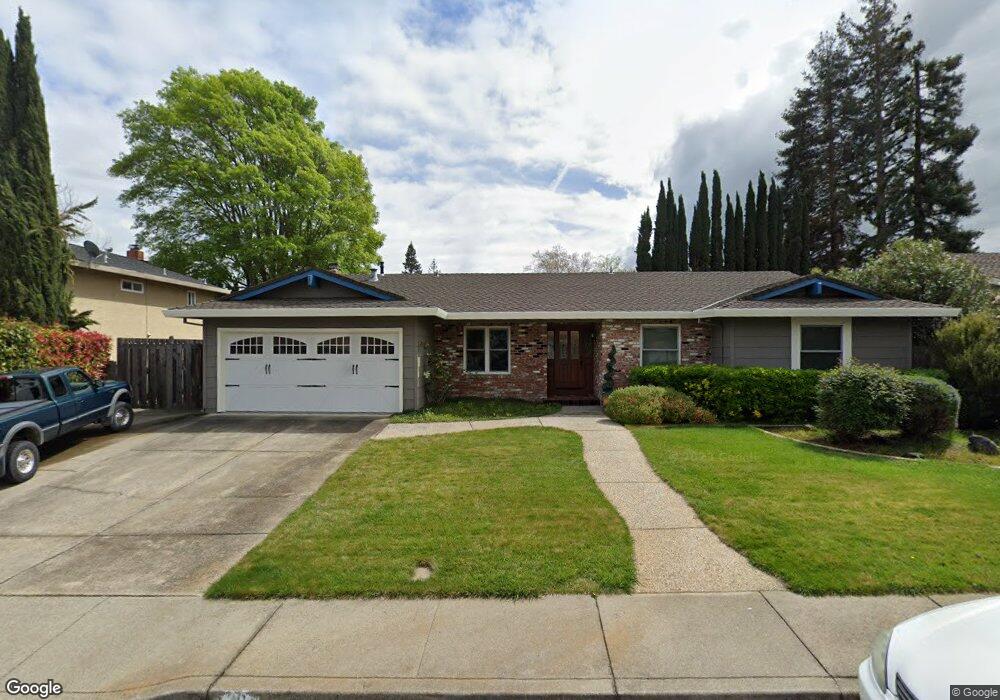
39 Mesa Vista Ct San Ramon, CA 94583
Twin Creeks NeighborhoodEstimated Value: $1,474,000 - $1,548,000
3
Beds
2
Baths
1,893
Sq Ft
$795/Sq Ft
Est. Value
About This Home
This home is located at 39 Mesa Vista Ct, San Ramon, CA 94583 and is currently estimated at $1,505,809, approximately $795 per square foot. 39 Mesa Vista Ct is a home located in Contra Costa County with nearby schools including Bollinger Canyon Elementary School, Iron Horse Middle School, and California High School.
Ownership History
Date
Name
Owned For
Owner Type
Purchase Details
Closed on
Aug 28, 2020
Sold by
Brickell Lawrence R and Brickell Susan M
Bought by
Brickell Lawrence R and Bock Susan M
Current Estimated Value
Home Financials for this Owner
Home Financials are based on the most recent Mortgage that was taken out on this home.
Original Mortgage
$460,000
Outstanding Balance
$407,462
Interest Rate
2.8%
Mortgage Type
New Conventional
Estimated Equity
$1,098,347
Purchase Details
Closed on
Feb 24, 2015
Sold by
Brickell Lawrence R and Bock Susan M
Bought by
The Brickell Bock Trust
Home Financials for this Owner
Home Financials are based on the most recent Mortgage that was taken out on this home.
Original Mortgage
$510,000
Interest Rate
3.57%
Mortgage Type
New Conventional
Purchase Details
Closed on
Dec 14, 2012
Sold by
Bock Susan M and Brickell Lawrence R
Bought by
Brickell Lawrence R and Bock Susan M
Home Financials for this Owner
Home Financials are based on the most recent Mortgage that was taken out on this home.
Original Mortgage
$405,500
Interest Rate
3.37%
Mortgage Type
New Conventional
Purchase Details
Closed on
Sep 23, 2011
Sold by
Bock Susan M and Brickell Lawrence R
Bought by
Brickell Lawrence R and Bock Susan M
Home Financials for this Owner
Home Financials are based on the most recent Mortgage that was taken out on this home.
Original Mortgage
$410,000
Interest Rate
4.15%
Mortgage Type
New Conventional
Purchase Details
Closed on
Aug 4, 2006
Sold by
Brickell Lawrence R and Bock Susan M
Bought by
Brickell Lawrence R and Bock Susan M
Purchase Details
Closed on
Oct 3, 2005
Sold by
Bock David Paul and Bock Carol Kay
Bought by
Brickell Lawrence R and Bock Susan M
Home Financials for this Owner
Home Financials are based on the most recent Mortgage that was taken out on this home.
Original Mortgage
$359,650
Interest Rate
5.7%
Mortgage Type
Fannie Mae Freddie Mac
Purchase Details
Closed on
Oct 20, 2004
Sold by
Bock David Paul and Bock Carol Kay
Bought by
Bock David Paul and Bock Carol Kay
Home Financials for this Owner
Home Financials are based on the most recent Mortgage that was taken out on this home.
Original Mortgage
$500,000
Interest Rate
5.74%
Mortgage Type
Credit Line Revolving
Purchase Details
Closed on
Nov 21, 1996
Sold by
Bock David P and Bock Carol K
Bought by
Bock David Paul and Bock Carol Kay
Create a Home Valuation Report for This Property
The Home Valuation Report is an in-depth analysis detailing your home's value as well as a comparison with similar homes in the area
Home Values in the Area
Average Home Value in this Area
Purchase History
| Date | Buyer | Sale Price | Title Company |
|---|---|---|---|
| Brickell Lawrence R | -- | Old Republic Title Company | |
| Brickell Lawrence R | -- | Old Republic Title Company | |
| The Brickell Bock Trust | -- | Old Republic Title Company | |
| Brickell Lawrence R | -- | Old Republic Title Company | |
| Brickell Lawrence R | -- | Chicago Title Company | |
| Bock Susan M | -- | Chicago Title Company | |
| Brickell Lawrence R | -- | Chicago Title Company | |
| Bock Susan M | -- | Chicago Title Company | |
| Brickell Lawrence R | -- | None Available | |
| Brickell Lawrence R | $679,000 | Fidelity National Title | |
| Bock David Paul | -- | Chicago Title Co | |
| Bock David Paul | -- | Chicago Title Co | |
| Bock David Paul | -- | -- | |
| Bock David P | -- | -- |
Source: Public Records
Mortgage History
| Date | Status | Borrower | Loan Amount |
|---|---|---|---|
| Open | Brickell Lawrence R | $460,000 | |
| Closed | Brickell Lawrence R | $510,000 | |
| Closed | Bock Susan M | $405,500 | |
| Closed | Brickell Lawrence R | $410,000 | |
| Previous Owner | Brickell Lawrence R | $359,650 | |
| Previous Owner | Bock David Paul | $500,000 |
Source: Public Records
Tax History Compared to Growth
Tax History
| Year | Tax Paid | Tax Assessment Tax Assessment Total Assessment is a certain percentage of the fair market value that is determined by local assessors to be the total taxable value of land and additions on the property. | Land | Improvement |
|---|---|---|---|---|
| 2025 | $10,812 | $927,897 | $795,347 | $132,550 |
| 2024 | $10,635 | $909,703 | $779,752 | $129,951 |
| 2023 | $10,635 | $891,866 | $764,463 | $127,403 |
| 2022 | $10,555 | $874,379 | $749,474 | $124,905 |
| 2021 | $10,325 | $857,235 | $734,779 | $122,456 |
| 2019 | $10,101 | $831,811 | $712,986 | $118,825 |
| 2018 | $9,724 | $815,502 | $699,006 | $116,496 |
| 2017 | $9,368 | $799,512 | $685,300 | $114,212 |
| 2016 | $9,247 | $783,836 | $671,863 | $111,973 |
| 2015 | $9,125 | $772,063 | $661,771 | $110,292 |
| 2014 | $8,353 | $698,500 | $598,716 | $99,784 |
Source: Public Records
Map
Nearby Homes
- 600 Guaymas Ct
- 2632 Campeche Ct
- 2720 Marsh Dr
- 2482 Wildhorse Dr
- Plan 3 at City Village - The Courts
- Plan 3 at City Village - The Towns
- Plan 1 at City Village - The Courts
- Plan 1 at City Village - The Towns
- Plan 3X at City Village - The Courts
- Plan 1X at City Village - The Courts
- Plan 2 at City Village - The Towns
- Plan 1 at City Village - The Rows
- Plan 4 at City Village - The Towns
- Plan 2 at City Village - The Rows
- Plan 2 at City Village - The Courts
- Plan 3 at City Village - The Rows
- 560 La Copita Ct
- 205 Compton Cir Unit B
- 44 Dos Rios Ct
- 412 Carillo Ct
- 35 Mesa Vista Ct
- 43 Mesa Vista Ct
- 68 Ayamonte Ct
- 70 Ayamonte Ct
- 66 Ayamonte Ct
- 36 Mesa Vista Ct
- 64 Ayamonte Ct
- 31 Mesa Vista Ct
- 72 Ayamonte Ct
- 44 Mesa Vista Ct
- 47 Mesa Vista Ct
- 62 Ayamonte Ct
- 32 Mesa Vista Ct
- 74 Ayamonte Ct
- 60 Ayamonte Ct
- 58 Mesa Vista Ct
- 76 Ayamonte Ct
- 51 Mesa Vista Ct
- 78 Ayamonte Ct
- 55 Mesa Vista Ct