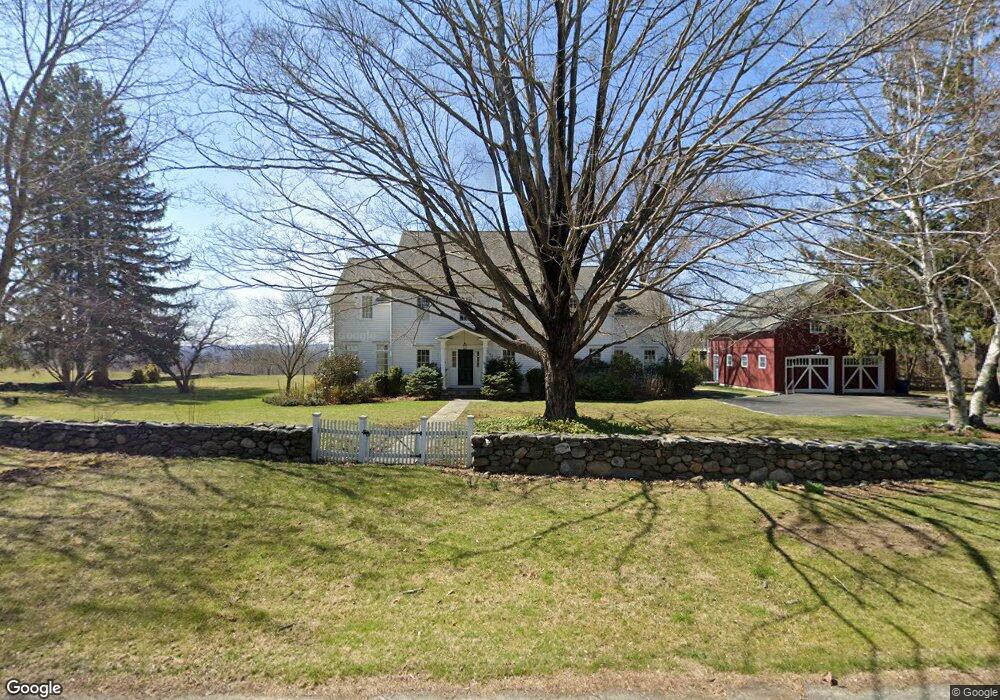
39 Northrop St Bridgewater, CT 06752
Estimated Value: $1,019,000 - $1,685,000
4
Beds
5
Baths
3,903
Sq Ft
$364/Sq Ft
Est. Value
About This Home
This home is located at 39 Northrop St, Bridgewater, CT 06752 and is currently estimated at $1,419,569, approximately $363 per square foot. 39 Northrop St is a home located in Litchfield County with nearby schools including Shepaug Valley School.
Ownership History
Date
Name
Owned For
Owner Type
Purchase Details
Closed on
Mar 25, 2011
Sold by
Debenedetto Karen
Bought by
Debenedetto Anthony
Current Estimated Value
Home Financials for this Owner
Home Financials are based on the most recent Mortgage that was taken out on this home.
Original Mortgage
$452,000
Interest Rate
4.99%
Purchase Details
Closed on
Jun 12, 1998
Sold by
Gailson Marion
Bought by
Dibenedetto Anthony and Dibenedetto Karen
Create a Home Valuation Report for This Property
The Home Valuation Report is an in-depth analysis detailing your home's value as well as a comparison with similar homes in the area
Home Values in the Area
Average Home Value in this Area
Purchase History
| Date | Buyer | Sale Price | Title Company |
|---|---|---|---|
| Debenedetto Anthony | -- | -- | |
| Debenedetto Anthony | -- | -- | |
| Dibenedetto Anthony | $255,000 | -- | |
| Dibenedetto Anthony | $255,000 | -- |
Source: Public Records
Mortgage History
| Date | Status | Borrower | Loan Amount |
|---|---|---|---|
| Open | Dibenedetto Anthony | $456,112 | |
| Closed | Dibenedetto Anthony | $452,000 |
Source: Public Records
Tax History Compared to Growth
Tax History
| Year | Tax Paid | Tax Assessment Tax Assessment Total Assessment is a certain percentage of the fair market value that is determined by local assessors to be the total taxable value of land and additions on the property. | Land | Improvement |
|---|---|---|---|---|
| 2025 | $15,059 | $792,600 | $303,800 | $488,800 |
| 2024 | $14,069 | $792,600 | $303,800 | $488,800 |
| 2023 | $13,276 | $792,600 | $303,800 | $488,800 |
| 2022 | $13,544 | $732,100 | $356,700 | $375,400 |
| 2021 | $12,812 | $732,100 | $356,700 | $375,400 |
| 2020 | $12,812 | $732,100 | $356,700 | $375,400 |
| 2019 | $12,812 | $732,100 | $356,700 | $375,400 |
| 2018 | $12,592 | $732,100 | $356,700 | $375,400 |
| 2017 | $12,592 | $732,100 | $356,700 | $375,400 |
| 2016 | $12,465 | $722,600 | $318,600 | $404,000 |
| 2015 | $12,465 | $722,600 | $318,600 | $404,000 |
| 2014 | $12,465 | $722,600 | $318,600 | $404,000 |
Source: Public Records
Map
Nearby Homes
- 6 Sarah Sanford Rd W
- 119 Keeler Rd
- 13 Nicoles Ct
- 26 Cove Rd
- 370 Northrop St
- 34 Riverford Rd
- 19 Kimberly Dr
- 190 Blueberry Hill Rd
- 19 Riverford Rd
- 72 Clapboard Rd
- 409 Northrop St
- 7 Hearthstone Dr
- 5 Hidden Brook Dr
- 52 Curtis Rd
- 1 Rajcula Farm Rd
- 44 Obtuse Rd N
- 1 Lisa Ct
- 4 Judge Rd
- 6 Lyndenwood Dr
- 62 Tepi Dr