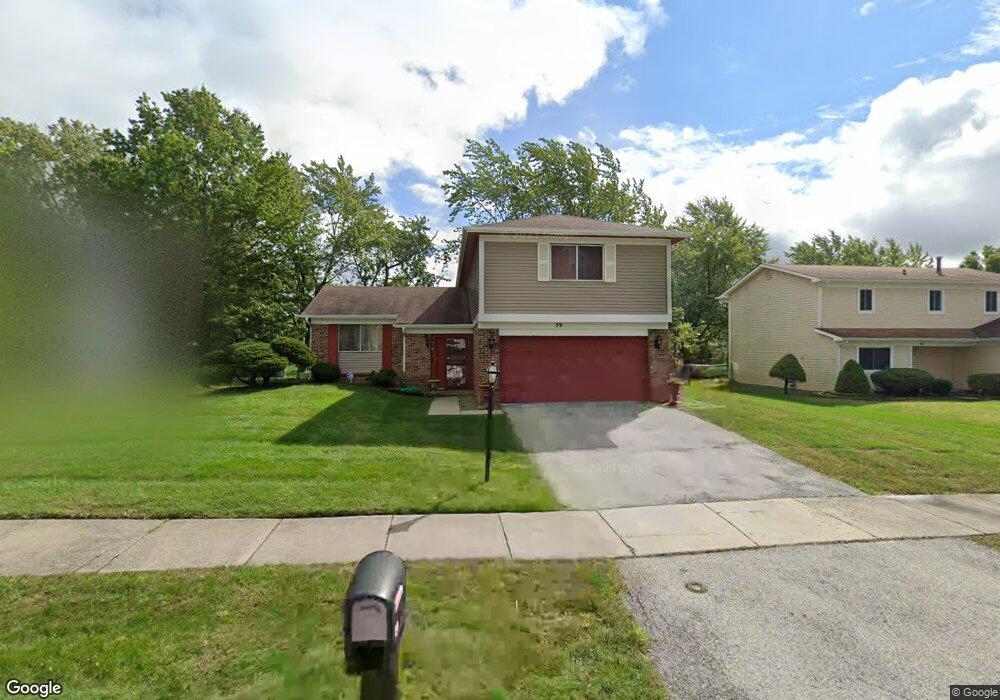
39 Pheasant Rd Matteson, IL 60443
West Matteson NeighborhoodEstimated Value: $229,867 - $242,000
3
Beds
3
Baths
1,776
Sq Ft
$134/Sq Ft
Est. Value
About This Home
This home is located at 39 Pheasant Rd, Matteson, IL 60443 and is currently estimated at $237,967, approximately $133 per square foot. 39 Pheasant Rd is a home located in Cook County with nearby schools including Colin Powell Middle School.
Ownership History
Date
Name
Owned For
Owner Type
Purchase Details
Closed on
Dec 22, 2025
Sold by
Mayetta Cook
Bought by
Mayetta Cook Revocable Living Trust
Current Estimated Value
Purchase Details
Closed on
Dec 23, 2003
Sold by
Green Edwin
Bought by
Cook Mayetta
Home Financials for this Owner
Home Financials are based on the most recent Mortgage that was taken out on this home.
Original Mortgage
$144,942
Interest Rate
5.91%
Mortgage Type
FHA
Purchase Details
Closed on
Jun 3, 2003
Sold by
Harrison Pamela A
Bought by
Homecomings Financial Network Inc
Purchase Details
Closed on
Jan 31, 2003
Sold by
Harrison Pamela A
Bought by
Homecomings Financial Network Inc
Purchase Details
Closed on
Jan 18, 1996
Sold by
Wells Lovie B
Bought by
Harrison Pamela A
Home Financials for this Owner
Home Financials are based on the most recent Mortgage that was taken out on this home.
Original Mortgage
$94,400
Interest Rate
8.33%
Mortgage Type
Balloon
Create a Home Valuation Report for This Property
The Home Valuation Report is an in-depth analysis detailing your home's value as well as a comparison with similar homes in the area
Home Values in the Area
Average Home Value in this Area
Purchase History
| Date | Buyer | Sale Price | Title Company |
|---|---|---|---|
| Mayetta Cook Revocable Living Trust | -- | None Listed On Document | |
| Cook Mayetta | $147,000 | Chicago Title Insurance Comp | |
| Homecomings Financial Network Inc | -- | Cti | |
| Homecomings Financial Network Inc | -- | -- | |
| Homecomings Financial Network Inc | -- | -- | |
| Harrison Pamela A | -- | -- |
Source: Public Records
Mortgage History
| Date | Status | Borrower | Loan Amount |
|---|---|---|---|
| Previous Owner | Cook Mayetta | $144,942 | |
| Previous Owner | Harrison Pamela A | $94,400 |
Source: Public Records
Tax History
| Year | Tax Paid | Tax Assessment Tax Assessment Total Assessment is a certain percentage of the fair market value that is determined by local assessors to be the total taxable value of land and additions on the property. | Land | Improvement |
|---|---|---|---|---|
| 2025 | $2,397 | $20,000 | $3,562 | $16,438 |
| 2024 | $2,397 | $20,000 | $3,562 | $16,438 |
| 2023 | $3,194 | $20,000 | $3,562 | $16,438 |
| 2022 | $3,194 | $15,670 | $3,117 | $12,553 |
| 2021 | $3,139 | $15,669 | $3,117 | $12,552 |
| 2020 | $2,826 | $15,669 | $3,117 | $12,552 |
| 2019 | $3,268 | $14,728 | $2,894 | $11,834 |
| 2018 | $4,601 | $14,728 | $2,894 | $11,834 |
| 2017 | $3,082 | $14,728 | $2,894 | $11,834 |
| 2016 | $4,327 | $12,643 | $2,671 | $9,972 |
| 2015 | $5,091 | $12,643 | $2,671 | $9,972 |
| 2014 | $4,980 | $12,643 | $2,671 | $9,972 |
| 2013 | $5,158 | $13,841 | $2,671 | $11,170 |
Source: Public Records
Map
Nearby Homes
- 42 Pheasant Rd
- 25 Pheasant Rd
- 41 Willow Rd
- 56 Timberlane Rd
- 124 Oriole Rd
- 115 Oriole Rd
- 6005 Woodgate Dr
- 50 Willow Rd
- 123 Oriole Rd
- 5943 Woodgate Dr
- 13 Oakview Rd
- 141 Timberlane Rd
- 152 Oakhurst Rd
- 10 Wedgewood Rd
- 40 Huntingwood Rd
- 6128 Wedgewood Ct
- 34 Wedgewood Rd
- 72 White Oaks Rd
- 133 Deerpath Rd
- 156 Cloverleaf Rd
Your Personal Tour Guide
Ask me questions while you tour the home.