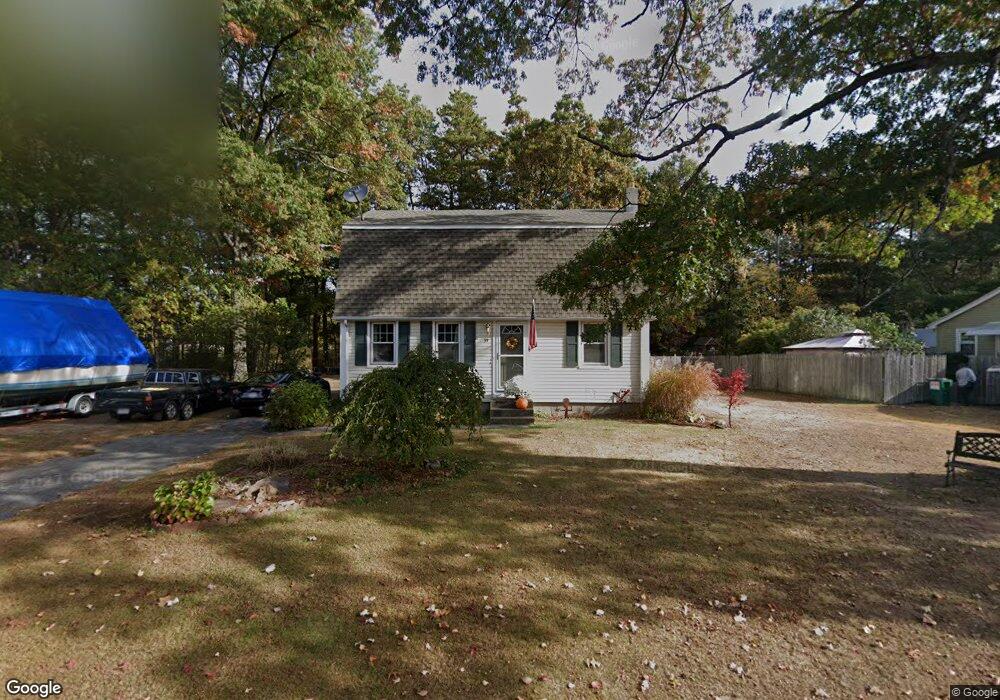
39 Phelps St Easthampton, MA 01027
Estimated Value: $364,000 - $387,000
3
Beds
2
Baths
1,440
Sq Ft
$260/Sq Ft
Est. Value
About This Home
This home is located at 39 Phelps St, Easthampton, MA 01027 and is currently estimated at $374,834, approximately $260 per square foot. 39 Phelps St is a home located in Hampshire County with nearby schools including Easthampton High School, Hilltown Cooperative Charter Public School, and Calvary Baptist Christian School.
Ownership History
Date
Name
Owned For
Owner Type
Purchase Details
Closed on
Jun 30, 1995
Sold by
Usa Va
Bought by
Guyette Ann L and Guyette Stevenr
Current Estimated Value
Purchase Details
Closed on
Sep 8, 1994
Sold by
Oconnell William J
Bought by
Usa Va
Purchase Details
Closed on
Nov 15, 1989
Sold by
Dupre Kenneth P
Bought by
Oconnell William J
Create a Home Valuation Report for This Property
The Home Valuation Report is an in-depth analysis detailing your home's value as well as a comparison with similar homes in the area
Home Values in the Area
Average Home Value in this Area
Purchase History
| Date | Buyer | Sale Price | Title Company |
|---|---|---|---|
| Guyette Ann L | $96,000 | -- | |
| Usa Va | $83,481 | -- | |
| Oconnell William J | $114,000 | -- |
Source: Public Records
Mortgage History
| Date | Status | Borrower | Loan Amount |
|---|---|---|---|
| Open | Oconnell William J | $138,633 | |
| Closed | Oconnell William J | $35,406 |
Source: Public Records
Tax History
| Year | Tax Paid | Tax Assessment Tax Assessment Total Assessment is a certain percentage of the fair market value that is determined by local assessors to be the total taxable value of land and additions on the property. | Land | Improvement |
|---|---|---|---|---|
| 2025 | $4,350 | $318,200 | $122,800 | $195,400 |
| 2024 | $4,191 | $309,100 | $119,200 | $189,900 |
| 2023 | $3,201 | $218,500 | $94,400 | $124,100 |
| 2022 | $3,612 | $218,500 | $94,400 | $124,100 |
| 2021 | $3,952 | $225,300 | $94,400 | $130,900 |
| 2020 | $3,881 | $218,500 | $94,400 | $124,100 |
| 2019 | $3,335 | $215,700 | $94,400 | $121,300 |
| 2018 | $3,216 | $201,000 | $89,300 | $111,700 |
| 2017 | $3,132 | $193,200 | $85,600 | $107,600 |
| 2016 | $3,241 | $207,900 | $85,600 | $122,300 |
| 2015 | $3,150 | $207,900 | $85,600 | $122,300 |
Source: Public Records
Map
Nearby Homes
Your Personal Tour Guide
Ask me questions while you tour the home.