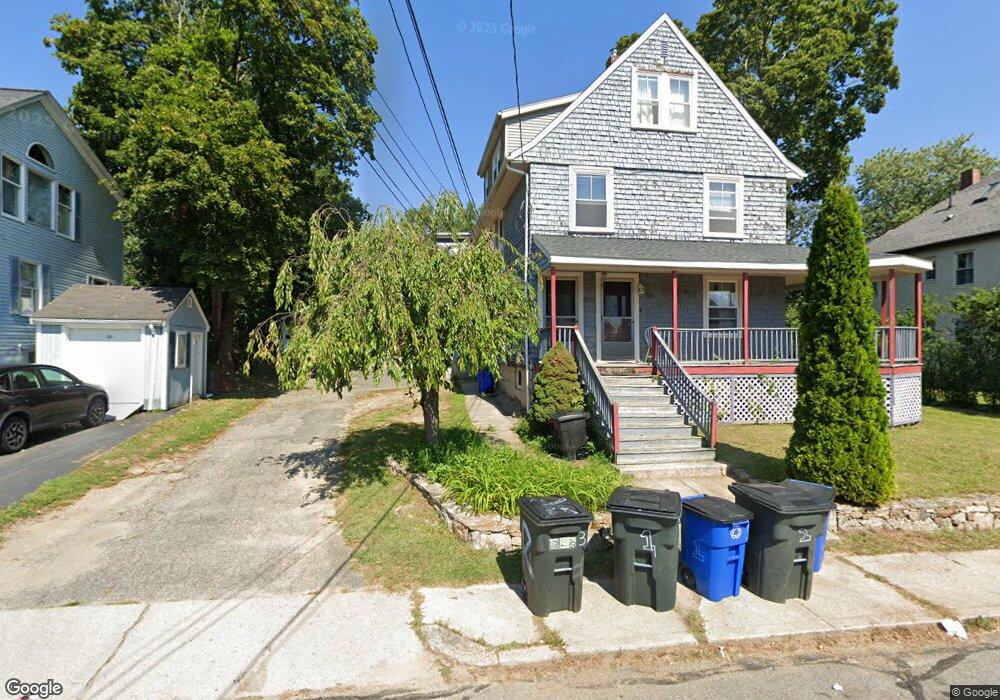
39 Pleasant St Unit 41 Milford, MA 01757
Estimated Value: $387,588 - $665,000
8
Beds
3
Baths
2,208
Sq Ft
$236/Sq Ft
Est. Value
About This Home
This home is located at 39 Pleasant St Unit 41, Milford, MA 01757 and is currently estimated at $520,397, approximately $235 per square foot. 39 Pleasant St Unit 41 is a home located in Worcester County with nearby schools including Milford High School and Bethany Christian Academy.
Ownership History
Date
Name
Owned For
Owner Type
Purchase Details
Closed on
Jul 21, 2017
Sold by
Testa Corey P
Bought by
Testa Corey P and Testa Lenore J
Current Estimated Value
Home Financials for this Owner
Home Financials are based on the most recent Mortgage that was taken out on this home.
Original Mortgage
$153,750
Outstanding Balance
$81,309
Interest Rate
3.94%
Mortgage Type
New Conventional
Estimated Equity
$439,088
Purchase Details
Closed on
Jul 14, 2017
Sold by
Bonina Mark F
Bought by
Testa Corey P
Home Financials for this Owner
Home Financials are based on the most recent Mortgage that was taken out on this home.
Original Mortgage
$153,750
Outstanding Balance
$81,309
Interest Rate
3.94%
Mortgage Type
New Conventional
Estimated Equity
$439,088
Purchase Details
Closed on
Aug 31, 1995
Sold by
Lawrence Rachel
Bought by
Bonina Mark F
Home Financials for this Owner
Home Financials are based on the most recent Mortgage that was taken out on this home.
Original Mortgage
$107,350
Interest Rate
7.61%
Mortgage Type
Commercial
Create a Home Valuation Report for This Property
The Home Valuation Report is an in-depth analysis detailing your home's value as well as a comparison with similar homes in the area
Home Values in the Area
Average Home Value in this Area
Purchase History
| Date | Buyer | Sale Price | Title Company |
|---|---|---|---|
| Testa Corey P | -- | -- | |
| Testa Corey P | $205,000 | -- | |
| Bonina Mark F | $113,000 | -- |
Source: Public Records
Mortgage History
| Date | Status | Borrower | Loan Amount |
|---|---|---|---|
| Open | Testa Corey P | $153,750 | |
| Previous Owner | Bonina Mark F | $210,870 | |
| Previous Owner | Bonina Mark F | $180,000 | |
| Previous Owner | Bonina Mark F | $28,673 | |
| Previous Owner | Bonina Mark F | $107,350 |
Source: Public Records
Tax History Compared to Growth
Tax History
| Year | Tax Paid | Tax Assessment Tax Assessment Total Assessment is a certain percentage of the fair market value that is determined by local assessors to be the total taxable value of land and additions on the property. | Land | Improvement |
|---|---|---|---|---|
| 2025 | $6,051 | $472,700 | $154,900 | $317,800 |
| 2024 | $5,927 | $446,000 | $147,700 | $298,300 |
| 2023 | $5,784 | $400,300 | $135,100 | $265,200 |
| 2022 | $5,656 | $367,500 | $122,500 | $245,000 |
| 2021 | $5,363 | $335,600 | $122,500 | $213,100 |
| 2020 | $5,260 | $329,600 | $122,500 | $207,100 |
| 2019 | $5,086 | $307,500 | $122,500 | $185,000 |
| 2018 | $4,425 | $267,200 | $122,500 | $144,700 |
| 2017 | $4,273 | $254,500 | $122,500 | $132,000 |
| 2016 | $4,298 | $250,200 | $122,500 | $127,700 |
| 2015 | $4,294 | $244,700 | $117,000 | $127,700 |
Source: Public Records
Map
Nearby Homes
- 43 Pleasant St
- 43 Pleasant St
- 35 Pleasant St Unit 37
- 42 W Walnut St
- 33 Pleasant St
- 40 W Walnut St
- 45 Pleasant St
- 38 Pleasant St
- 36 Pleasant St
- 36 Pleasant St Unit 1
- 40 Pleasant St
- 38 W Walnut St
- 34 Pleasant St
- 42 Pleasant St
- 32 Pleasant St
- 29 Pleasant St
- 28 W Walnut St
- 85 High St
- 153 W Spruce St
- 147 W Spruce St