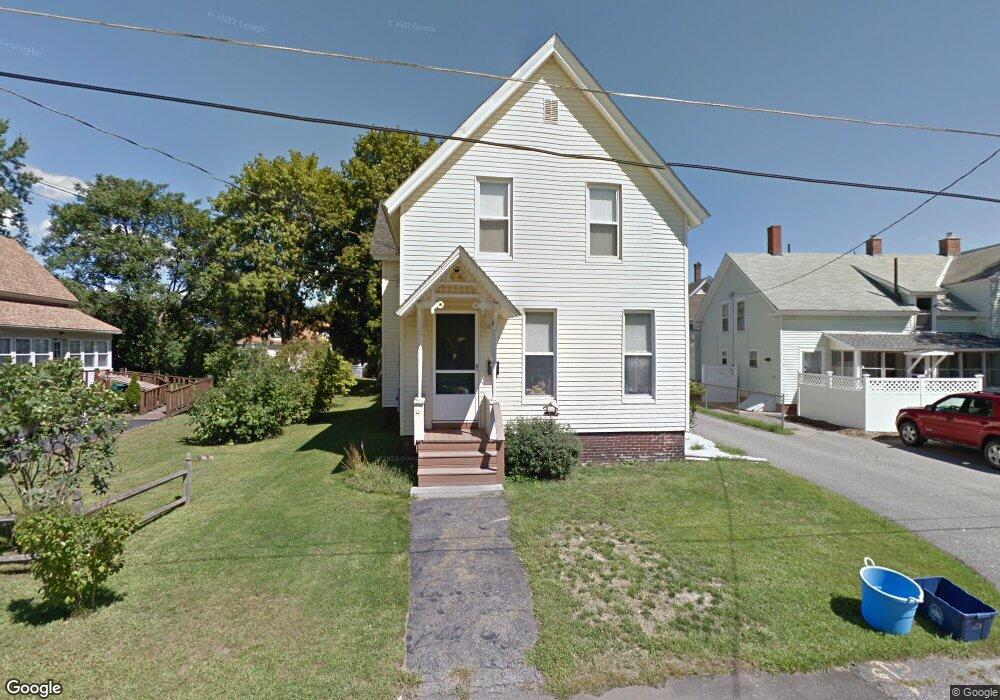
39 Spruce St Concord, NH 03301
South End NeighborhoodEstimated Value: $453,631 - $475,000
4
Beds
1
Bath
1,735
Sq Ft
$268/Sq Ft
Est. Value
About This Home
This home is located at 39 Spruce St, Concord, NH 03301 and is currently estimated at $465,158, approximately $268 per square foot. 39 Spruce St is a home located in Merrimack County with nearby schools including Abbot-Downing School, Rundlett Middle School, and Concord High School.
Ownership History
Date
Name
Owned For
Owner Type
Purchase Details
Closed on
Aug 2, 2005
Sold by
Burns Robert D and Burns Louise A
Bought by
Moore Jason R and Moore Lisa
Current Estimated Value
Home Financials for this Owner
Home Financials are based on the most recent Mortgage that was taken out on this home.
Original Mortgage
$190,000
Outstanding Balance
$34,490
Interest Rate
5.67%
Mortgage Type
Purchase Money Mortgage
Estimated Equity
$430,668
Purchase Details
Closed on
Apr 1, 1997
Sold by
Tasker Irene P
Bought by
Burns Robert D and Burns Louise A
Home Financials for this Owner
Home Financials are based on the most recent Mortgage that was taken out on this home.
Original Mortgage
$70,501
Interest Rate
7.59%
Mortgage Type
Purchase Money Mortgage
Create a Home Valuation Report for This Property
The Home Valuation Report is an in-depth analysis detailing your home's value as well as a comparison with similar homes in the area
Home Values in the Area
Average Home Value in this Area
Purchase History
| Date | Buyer | Sale Price | Title Company |
|---|---|---|---|
| Moore Jason R | $220,000 | -- | |
| Moore Jason | $220,000 | -- | |
| Burns Robert D | $69,900 | -- |
Source: Public Records
Mortgage History
| Date | Status | Borrower | Loan Amount |
|---|---|---|---|
| Open | Moore Jason | $190,000 | |
| Closed | Burns Robert D | $190,000 | |
| Previous Owner | Burns Robert D | $70,501 |
Source: Public Records
Tax History
| Year | Tax Paid | Tax Assessment Tax Assessment Total Assessment is a certain percentage of the fair market value that is determined by local assessors to be the total taxable value of land and additions on the property. | Land | Improvement |
|---|---|---|---|---|
| 2025 | $8,407 | $288,800 | $102,300 | $186,500 |
| 2024 | $7,997 | $288,800 | $102,300 | $186,500 |
| 2023 | $7,757 | $288,800 | $102,300 | $186,500 |
| 2022 | $7,477 | $288,800 | $102,300 | $186,500 |
| 2021 | $7,255 | $288,800 | $102,300 | $186,500 |
| 2020 | $7,148 | $267,100 | $85,500 | $181,600 |
| 2019 | $6,895 | $248,200 | $84,200 | $164,000 |
| 2018 | $6,388 | $226,600 | $80,800 | $145,800 |
| 2017 | $6,063 | $214,700 | $79,300 | $135,400 |
| 2016 | $5,697 | $205,900 | $79,300 | $126,600 |
| 2015 | $5,443 | $195,900 | $72,100 | $123,800 |
| 2014 | $4,775 | $195,900 | $72,100 | $123,800 |
| 2013 | -- | $177,100 | $72,100 | $105,000 |
| 2012 | -- | $186,100 | $72,100 | $114,000 |
Source: Public Records
Map
Nearby Homes
- 20 Carter St
- 1 Matthew St Unit 6
- 47 South St
- 58 S State St
- 7-9 Myrtle St
- 0 South St Unit 4969509
- 5 Broad Ave
- 24 Hazel Dr
- 30 Longmeadow Dr
- 22 Fairfield Dr
- 20 Fairfield Dr
- 289 South St
- 19 Grappone Dr
- 28 Stevens Dr
- 157 Rumford St
- 30 Penacook St
- 5 Ormond St
- 128 Loudon Rd Unit 12F
- 20 Grandview Rd
- 12 E Side Dr Unit 16
Your Personal Tour Guide
Ask me questions while you tour the home.