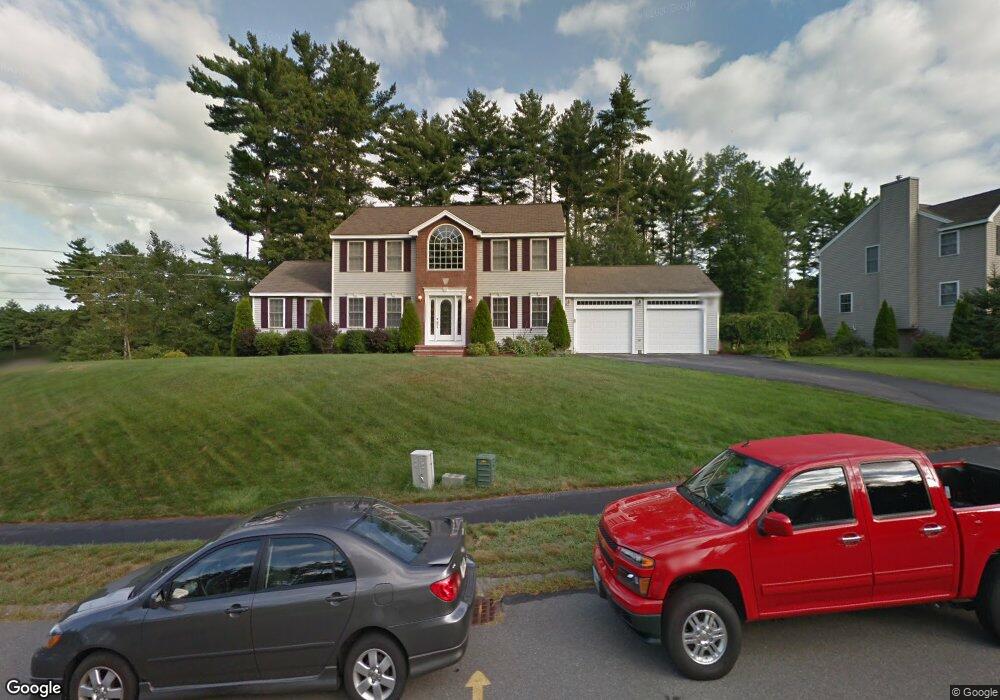
39 Sutherland Dr Hudson, NH 03051
Estimated Value: $754,000 - $792,000
3
Beds
3
Baths
3,081
Sq Ft
$250/Sq Ft
Est. Value
About This Home
This home is located at 39 Sutherland Dr, Hudson, NH 03051 and is currently estimated at $769,238, approximately $249 per square foot. 39 Sutherland Dr is a home located in Hillsborough County with nearby schools including Hills Garrison Elementary School, Hudson Memorial School, and Alvirne High School.
Ownership History
Date
Name
Owned For
Owner Type
Purchase Details
Closed on
Feb 3, 2014
Sold by
Decato Myrna L
Bought by
Macaloney Neil T and Macaloney Justine M
Current Estimated Value
Home Financials for this Owner
Home Financials are based on the most recent Mortgage that was taken out on this home.
Original Mortgage
$345,267
Outstanding Balance
$247,360
Interest Rate
4.47%
Mortgage Type
VA
Estimated Equity
$521,878
Purchase Details
Closed on
Nov 12, 2013
Sold by
Decato Myrna L
Bought by
Decato Myrna L
Purchase Details
Closed on
May 27, 2011
Sold by
Joubert 2Nd Pastor and Joubert Gina M
Bought by
Bellot Myrna L
Home Financials for this Owner
Home Financials are based on the most recent Mortgage that was taken out on this home.
Original Mortgage
$210,000
Interest Rate
4.94%
Mortgage Type
Purchase Money Mortgage
Purchase Details
Closed on
Oct 1, 1999
Sold by
Sousa Rlty & Dev Corp
Bought by
Joubert Ii Pastor and Joubert Gina M
Create a Home Valuation Report for This Property
The Home Valuation Report is an in-depth analysis detailing your home's value as well as a comparison with similar homes in the area
Home Values in the Area
Average Home Value in this Area
Purchase History
We collect this data history from publicly available records. To have your information removed, we recommend requesting removal directly through your county’s website.
| Date | Buyer | Sale Price | Title Company |
|---|---|---|---|
| Macaloney Neil T | $338,000 | -- | |
| Macaloney Neil T | $338,000 | -- | |
| Decato Myrna L | -- | -- | |
| Decato Myrna L | -- | -- | |
| Bellot Myrna L | $358,900 | -- | |
| Bellot Myrna L | $358,900 | -- | |
| Joubert Ii Pastor | $195,100 | -- | |
| Joubert Pastor | $195,100 | -- |
Source: Public Records
Mortgage History
We collect this data history from publicly available records. To have your information removed, we recommend requesting removal directly through your county’s website.
| Date | Status | Borrower | Loan Amount |
|---|---|---|---|
| Open | Joubert Pastor | $345,267 | |
| Closed | Joubert Pastor | $345,267 | |
| Previous Owner | Joubert Pastor | $210,000 |
Source: Public Records
Tax History
| Year | Tax Paid | Tax Assessment Tax Assessment Total Assessment is a certain percentage of the fair market value that is determined by local assessors to be the total taxable value of land and additions on the property. | Land | Improvement |
|---|---|---|---|---|
| 2025 | $10,192 | $595,700 | $151,000 | $444,700 |
| 2024 | $9,799 | $595,700 | $151,000 | $444,700 |
| 2023 | $9,341 | $595,700 | $151,000 | $444,700 |
| 2022 | $8,751 | $595,700 | $151,000 | $444,700 |
| 2021 | $7,676 | $354,200 | $112,900 | $241,300 |
| 2020 | $7,806 | $365,300 | $112,900 | $252,400 |
| 2019 | $7,408 | $365,300 | $112,900 | $252,400 |
| 2018 | $7,343 | $365,300 | $112,900 | $252,400 |
| 2017 | $7,204 | $365,300 | $112,900 | $252,400 |
| 2016 | $7,375 | $335,700 | $104,600 | $231,100 |
| 2015 | $7,081 | $333,200 | $104,600 | $228,600 |
| 2014 | $6,941 | $333,200 | $104,600 | $228,600 |
| 2013 | $6,890 | $335,100 | $104,600 | $230,500 |
Source: Public Records
Map
Nearby Homes
- 27 Scottsdale Dr
- 6 Anita Dr Unit 11
- 61 Barbara Ln
- 4 Timothy Ln
- 175 Derry Rd
- 42 Barretts Hill Rd Unit A
- 73 Ferry St
- 20 Alvirne Dr
- 7 Vernon St
- 169 Central St
- 213 Abbott Farm Ln
- 149 Barretts Hill Rd
- 46 Windham Rd Unit B
- 18 Windsor Ln Unit 70
- 5 Shoreline Dr Unit 14
- 12 Leclair Dr
- 25 Shadowbrook Dr Unit B
- 6 Tammy Ct Unit B
- 24 Windsor Ln Unit 10
- 21 Windsor Ln Unit A
- 34 Sutherland Dr
- 38 Sutherland Dr
- 32 Sutherland Dr
- 35 Sutherland Dr
- 40 Sutherland Dr
- 33 Sutherland Dr
- 30 Sutherland Dr
- 5 Logan Ct
- 6 Logan Ct
- 6 Logan Ct Unit 20
- 4 Logan Ct
- 4 Logan Ct Unit 19
- 31 Sutherland Dr
- 2 Logan Ct
- 3 Rosemary Ct
- 1 Rosemary Ct
- 5 Rosemary Ct
- 29 Sutherland Dr
- 68 Sousa Blvd
- 7 Rosemary Ct
Your Personal Tour Guide
Ask me questions while you tour the home.