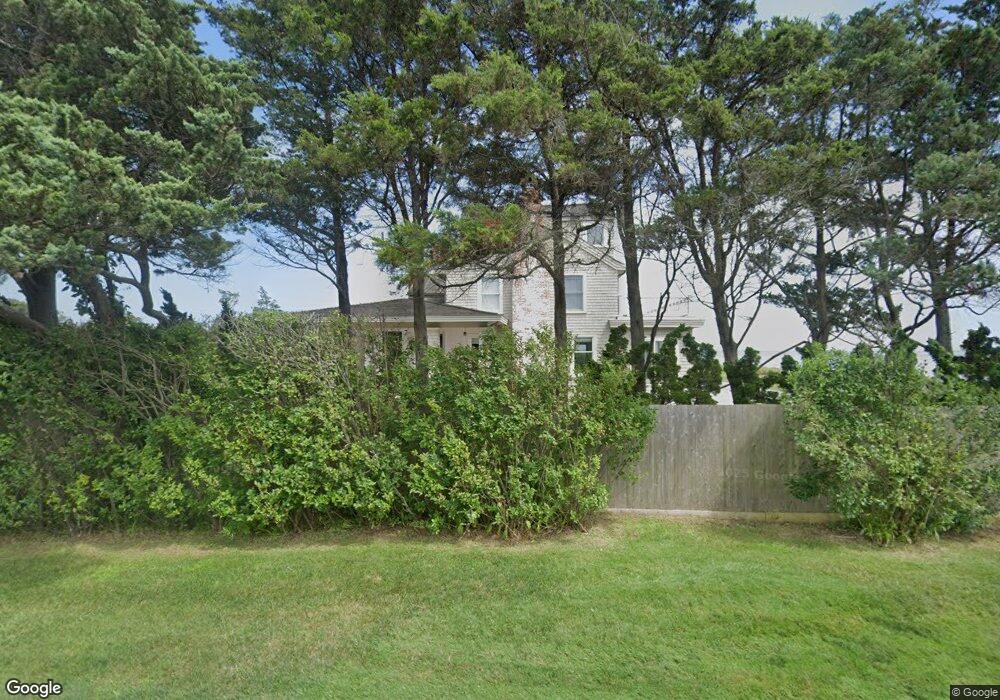
39 Thorn Hedge Rd Bellport, NY 11713
Estimated Value: $645,957 - $4,330,000
--
Bed
--
Bath
--
Sq Ft
1.75
Acres
About This Home
This home is located at 39 Thorn Hedge Rd, Bellport, NY 11713 and is currently estimated at $1,785,489. 39 Thorn Hedge Rd is a home located in Suffolk County with nearby schools including Frank P Long Intermediate School, Bellport Middle School, and Bellport Senior High School.
Ownership History
Date
Name
Owned For
Owner Type
Purchase Details
Closed on
Feb 2, 2016
Sold by
Williams Vaughn C
Bought by
Kahr Julia C and Colton Brian S
Current Estimated Value
Home Financials for this Owner
Home Financials are based on the most recent Mortgage that was taken out on this home.
Original Mortgage
$1,999,999
Outstanding Balance
$1,581,733
Interest Rate
3.79%
Mortgage Type
New Conventional
Estimated Equity
$203,756
Purchase Details
Closed on
Aug 21, 1998
Sold by
Rose Charles P
Bought by
Williams Vaugh C
Purchase Details
Closed on
May 24, 1995
Sold by
Waterman T Preston and Waterman Virginia E
Bought by
Rose Charles P
Purchase Details
Closed on
Dec 15, 1994
Sold by
Waterman T Preston
Bought by
The Thornhedge Trust
Create a Home Valuation Report for This Property
The Home Valuation Report is an in-depth analysis detailing your home's value as well as a comparison with similar homes in the area
Home Values in the Area
Average Home Value in this Area
Purchase History
| Date | Buyer | Sale Price | Title Company |
|---|---|---|---|
| Kahr Julia C | $3,240,000 | Fidelity National Title | |
| Kahr Julia C | $3,240,000 | Fidelity National Title | |
| Williams Vaugh C | $1,675,000 | Title Associates Inc | |
| Williams Vaugh C | $1,675,000 | Title Associates Inc | |
| Rose Charles P | $850,000 | Chicago Title Insurance Co | |
| Rose Charles P | $850,000 | Chicago Title Insurance Co | |
| The Thornhedge Trust | -- | First American Title Ins Co | |
| The Thornhedge Trust | -- | First American Title Ins Co |
Source: Public Records
Mortgage History
| Date | Status | Borrower | Loan Amount |
|---|---|---|---|
| Open | Kahr Julia C | $1,999,999 | |
| Closed | Kahr Julia C | $1,999,999 |
Source: Public Records
Tax History Compared to Growth
Tax History
| Year | Tax Paid | Tax Assessment Tax Assessment Total Assessment is a certain percentage of the fair market value that is determined by local assessors to be the total taxable value of land and additions on the property. | Land | Improvement |
|---|---|---|---|---|
| 2024 | $28,727 | $8,010 | $2,800 | $5,210 |
| 2023 | $28,727 | $8,010 | $2,800 | $5,210 |
| 2022 | $26,102 | $8,010 | $2,800 | $5,210 |
| 2021 | $26,102 | $8,010 | $2,800 | $5,210 |
| 2020 | $27,061 | $8,010 | $2,800 | $5,210 |
| 2019 | $27,061 | $0 | $0 | $0 |
| 2018 | $25,562 | $8,010 | $2,800 | $5,210 |
| 2017 | $25,562 | $8,010 | $2,800 | $5,210 |
| 2016 | $25,508 | $8,010 | $2,800 | $5,210 |
| 2015 | -- | $8,010 | $2,800 | $5,210 |
| 2014 | -- | $8,010 | $2,800 | $5,210 |
Source: Public Records
Map
Nearby Homes
- 44 Thorn Hedge Rd
- 6 Point Rd
- 42 Thorn Hedge Rd
- 42 Thornhedge Rd
- 10 Point Rd
- 12 Point Rd
- 97 S Howells Point Rd
- 97 S Howells Point Rd
- 27 Thorn Hedge Rd
- 40 Thorn Hedge Rd
- 8 Point Rd
- 36 Thorn Hedge Rd
- 95 S Howells Point Rd
- 6 Bayberry Rd
- 99 Maple Ave
- 25 Thornhedge Rd
- 25 Thorn Hedge Rd
- 34 Thorn Hedge Rd
- 9 Point Rd
- 15 Point Rd