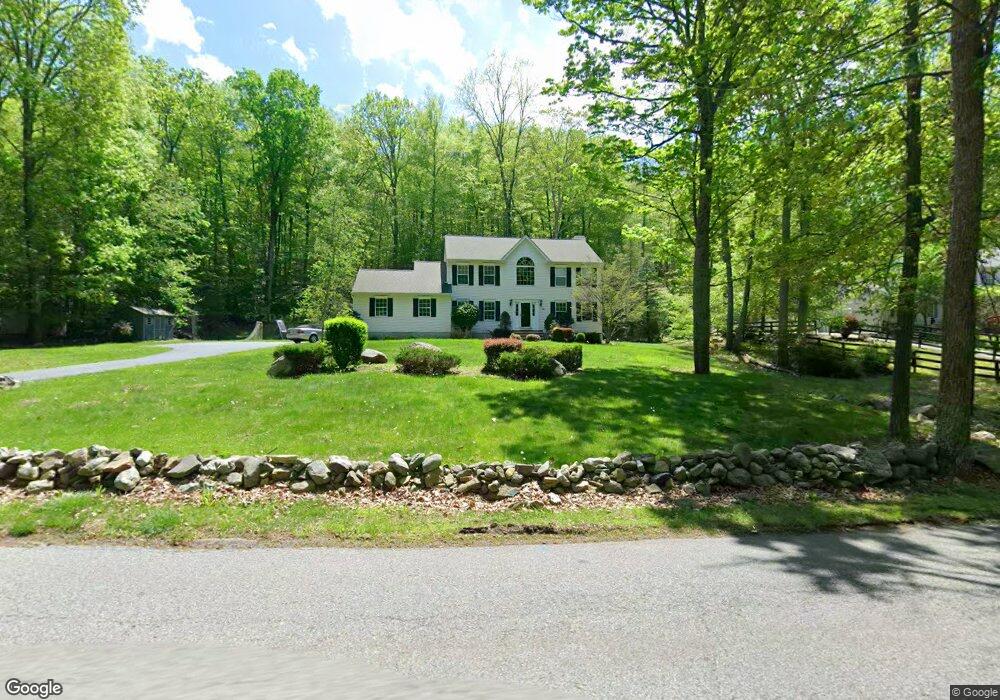
39 Tomahawk Trail Sparta, NJ 07871
Estimated Value: $690,489 - $896,000
Studio
--
Bath
2,447
Sq Ft
$314/Sq Ft
Est. Value
About This Home
This home is located at 39 Tomahawk Trail, Sparta, NJ 07871 and is currently estimated at $767,622, approximately $313 per square foot. 39 Tomahawk Trail is a home located in Sussex County with nearby schools including Sparta High School and Alpine Montessori - Sparta.
Ownership History
Date
Name
Owned For
Owner Type
Purchase Details
Closed on
May 2, 2001
Sold by
Schluter Richard and Schluter Nancy A
Bought by
Rippey Ronald and Rippey Jennifer
Current Estimated Value
Home Financials for this Owner
Home Financials are based on the most recent Mortgage that was taken out on this home.
Original Mortgage
$320,000
Outstanding Balance
$118,160
Interest Rate
6.88%
Estimated Equity
$649,462
Purchase Details
Closed on
Jul 17, 1998
Sold by
Milton Construction Corp
Bought by
Schluter Richard and Schluter Nancy A
Home Financials for this Owner
Home Financials are based on the most recent Mortgage that was taken out on this home.
Original Mortgage
$208,000
Interest Rate
6.99%
Purchase Details
Closed on
Oct 16, 1997
Sold by
Ridge Hollow Developers Inc
Bought by
Milton Construction Corp
Create a Home Valuation Report for This Property
The Home Valuation Report is an in-depth analysis detailing your home's value as well as a comparison with similar homes in the area
Home Values in the Area
Average Home Value in this Area
Purchase History
| Date | Buyer | Sale Price | Title Company |
|---|---|---|---|
| Rippey Ronald | $357,000 | -- | |
| Schluter Richard | $279,900 | Chicago Title Insurance Co | |
| Milton Construction Corp | $700,000 | -- |
Source: Public Records
Mortgage History
| Date | Status | Borrower | Loan Amount |
|---|---|---|---|
| Open | Rippey Ronald | $320,000 | |
| Previous Owner | Schluter Richard | $208,000 |
Source: Public Records
Tax History
| Year | Tax Paid | Tax Assessment Tax Assessment Total Assessment is a certain percentage of the fair market value that is determined by local assessors to be the total taxable value of land and additions on the property. | Land | Improvement |
|---|---|---|---|---|
| 2025 | $14,133 | $393,800 | $167,500 | $226,300 |
| 2024 | $13,728 | $393,800 | $167,500 | $226,300 |
| 2023 | $13,728 | $393,800 | $167,500 | $226,300 |
| 2022 | $13,397 | $393,800 | $167,500 | $226,300 |
| 2021 | $13,184 | $393,800 | $167,500 | $226,300 |
| 2020 | $13,389 | $393,800 | $167,500 | $226,300 |
| 2019 | $13,043 | $393,800 | $167,500 | $226,300 |
| 2018 | $12,767 | $393,800 | $167,500 | $226,300 |
| 2017 | $12,609 | $393,800 | $167,500 | $226,300 |
| 2016 | $12,314 | $393,800 | $167,500 | $226,300 |
| 2015 | $13,452 | $345,900 | $101,000 | $244,900 |
| 2014 | $13,234 | $345,900 | $101,000 | $244,900 |
Source: Public Records
Map
Nearby Homes
- 99 Seneca Lake Rd
- 8 S White Birch Terrace
- 14 Seneca Lake Terrace
- 305 Green Rd
- 186 Tomahawk Trail
- 22 Mountain Heights Dr
- 10 Gristmill Unit 10
- 78 Woodlawn Rd
- 52 Manor Square
- 36 Westbury Dr
- 54 Hillside Rd
- 270 Springbrook Trail
- 52 Longview Rd
- 187 E Shore Trail
- 159 E Shore Trail
- 9 Balsam Pkwy
- 330 Springbrook Trail
- 558 Stanhope Rd
- 97 Springbrook Trail
- 4 Shelley Ct
- 45 Tomahawk Trail
- 29 Tomahawk Trail
- 16 Tomahawk Trail
- 23 Tomahawk Trail
- 54 Tomahawk Trail
- 57 Tomahawk Trail
- 11 Continental Dr
- 17 Tomahawk Trail
- 66 Tomahawk Trail
- 65 Tomahawk Trail
- 69 Tomahawk Trail
- 10 Continental Dr
- 206 Green Rd
- 73 Tomahawk Trail
- 7 Continental Dr
- 180 Green Rd
- 218 Green Rd
- 6 Continental Dr
- 260 Sawmill Rd
- 83 Tomahawk Trail
Your Personal Tour Guide
Ask me questions while you tour the home.