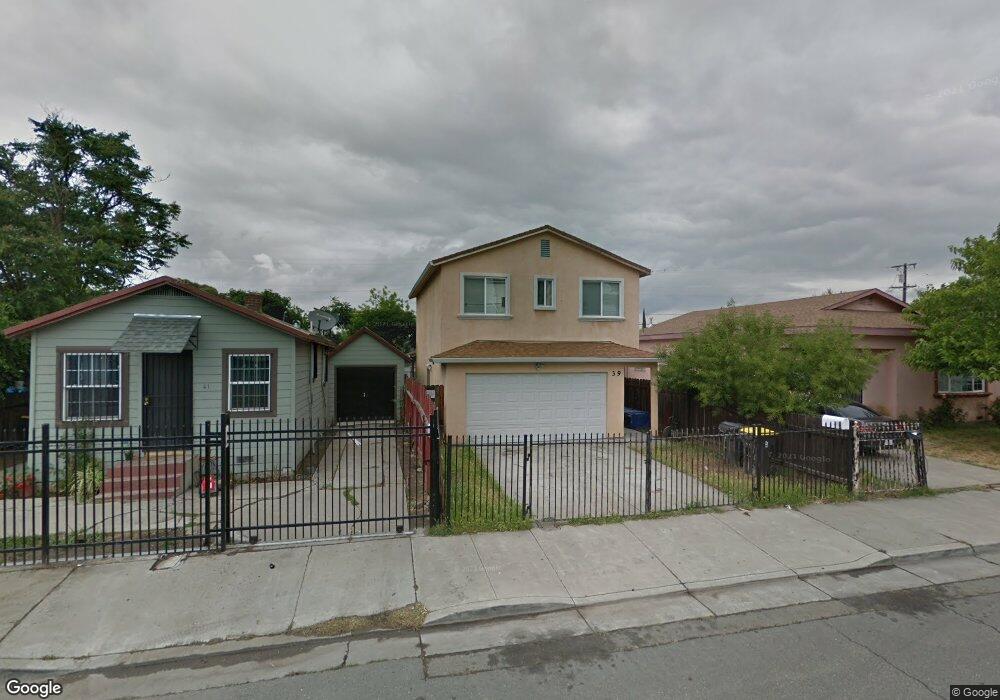
39 W 8th St Stockton, CA 95206
Seaport NeighborhoodEstimated Value: $233,000 - $417,000
4
Beds
3
Baths
1,275
Sq Ft
$270/Sq Ft
Est. Value
About This Home
This home is located at 39 W 8th St, Stockton, CA 95206 and is currently estimated at $344,195, approximately $269 per square foot. 39 W 8th St is a home located in San Joaquin County with nearby schools including McKinley Elementary School, Dolores Huerta Elementary School, and Hazelton Elementary School.
Ownership History
Date
Name
Owned For
Owner Type
Purchase Details
Closed on
Sep 17, 2015
Sold by
Bravo Guillermina and Manzo Laura
Bought by
Bravo Guillermina
Current Estimated Value
Home Financials for this Owner
Home Financials are based on the most recent Mortgage that was taken out on this home.
Original Mortgage
$127,500
Outstanding Balance
$99,972
Interest Rate
3.86%
Mortgage Type
New Conventional
Estimated Equity
$244,223
Purchase Details
Closed on
Nov 2, 2011
Sold by
Bravo Guillermina and Manzo Laura
Bought by
Bravo Guillermina and Manzo Laura
Home Financials for this Owner
Home Financials are based on the most recent Mortgage that was taken out on this home.
Original Mortgage
$58,500
Interest Rate
4.02%
Mortgage Type
New Conventional
Purchase Details
Closed on
Aug 8, 2011
Sold by
Bravo Marco Antonio
Bought by
Bravo Guillermina
Purchase Details
Closed on
Sep 19, 2006
Sold by
Robles Melba
Bought by
Bravo Marco Antonio and Bravo Guillermina
Purchase Details
Closed on
Feb 11, 2006
Sold by
Robles Theresa F
Bought by
Robles Melba
Purchase Details
Closed on
Dec 27, 2005
Sold by
Peraza Erika J
Bought by
Robles Melba
Purchase Details
Closed on
Jul 24, 1999
Sold by
Robles Jose G
Bought by
Robles Theresa and Robles Melba
Create a Home Valuation Report for This Property
The Home Valuation Report is an in-depth analysis detailing your home's value as well as a comparison with similar homes in the area
Home Values in the Area
Average Home Value in this Area
Purchase History
| Date | Buyer | Sale Price | Title Company |
|---|---|---|---|
| Bravo Guillermina | -- | Chicago Title Company | |
| Bravo Guillermina | -- | First American Title Company | |
| Bravo Guillermina | -- | None Available | |
| Bravo Marco Antonio | $65,000 | Old Republic Title Company | |
| Robles Melba | -- | None Available | |
| Robles Melba | -- | None Available | |
| Robles Theresa | -- | -- |
Source: Public Records
Mortgage History
| Date | Status | Borrower | Loan Amount |
|---|---|---|---|
| Open | Bravo Guillermina | $127,500 | |
| Closed | Bravo Guillermina | $58,500 |
Source: Public Records
Tax History Compared to Growth
Tax History
| Year | Tax Paid | Tax Assessment Tax Assessment Total Assessment is a certain percentage of the fair market value that is determined by local assessors to be the total taxable value of land and additions on the property. | Land | Improvement |
|---|---|---|---|---|
| 2025 | $2,768 | $222,805 | $100,476 | $122,329 |
| 2024 | $2,724 | $218,437 | $98,506 | $119,931 |
| 2023 | $2,663 | $214,155 | $96,575 | $117,580 |
| 2022 | $2,615 | $209,957 | $94,682 | $115,275 |
| 2021 | $2,512 | $205,841 | $92,826 | $113,015 |
| 2020 | $2,562 | $203,732 | $91,875 | $111,857 |
| 2019 | $2,552 | $199,738 | $90,074 | $109,664 |
| 2018 | $2,505 | $195,822 | $88,308 | $107,514 |
| 2017 | $2,372 | $191,983 | $86,577 | $105,406 |
| 2016 | $2,417 | $188,220 | $84,880 | $103,340 |
| 2015 | $2,416 | $185,395 | $83,606 | $101,789 |
| 2014 | $2,299 | $181,764 | $81,968 | $99,796 |
Source: Public Records
Map
Nearby Homes
- 2332 S Madison St
- 220 Delhi Ave
- 1926 S San Joaquin St
- 231 E 5th St
- 421 E 8th St
- 364 W 7th St
- 314 Kolher St
- 407 W 7th St
- 332 Kolher St
- 1932 S Lincoln St
- 1827 S California St
- 426 Howard St
- 1723 S Sutter St
- 2211 Peralta Ave
- 2213 Peralta Ave
- 2624 S Monroe St
- 174 Horton Ave
- 509 Howard St
- 719 Hyde Ct
- 544 W 9th St