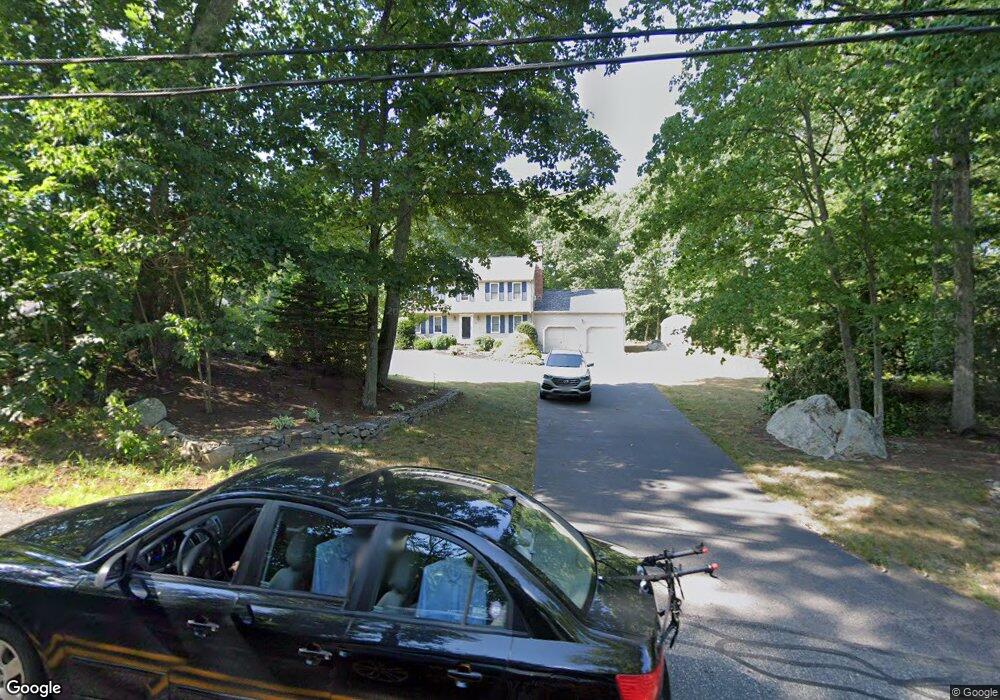
390 Central St Milford, MA 01757
Estimated Value: $665,868 - $778,000
4
Beds
3
Baths
1,832
Sq Ft
$381/Sq Ft
Est. Value
About This Home
This home is located at 390 Central St, Milford, MA 01757 and is currently estimated at $697,467, approximately $380 per square foot. 390 Central St is a home located in Worcester County with nearby schools including Milford High School and Bethany Christian Academy.
Ownership History
Date
Name
Owned For
Owner Type
Purchase Details
Closed on
Jun 25, 2018
Sold by
Us Bank Na Tr
Bought by
Deoliveira Jumar
Current Estimated Value
Home Financials for this Owner
Home Financials are based on the most recent Mortgage that was taken out on this home.
Original Mortgage
$425,250
Outstanding Balance
$368,543
Interest Rate
4.5%
Mortgage Type
New Conventional
Estimated Equity
$328,924
Purchase Details
Closed on
Sep 28, 2011
Sold by
Fair Cynthia F and Buchanan Sharon J
Bought by
Gulla Richard
Home Financials for this Owner
Home Financials are based on the most recent Mortgage that was taken out on this home.
Original Mortgage
$256,000
Interest Rate
4.15%
Mortgage Type
Purchase Money Mortgage
Purchase Details
Closed on
Jul 31, 1996
Sold by
F&D Central Realty Co
Bought by
Buchanan Sharon and Fair Cynthia
Create a Home Valuation Report for This Property
The Home Valuation Report is an in-depth analysis detailing your home's value as well as a comparison with similar homes in the area
Home Values in the Area
Average Home Value in this Area
Purchase History
| Date | Buyer | Sale Price | Title Company |
|---|---|---|---|
| Deoliveira Jumar | $472,500 | -- | |
| Gulla Richard | $320,000 | -- | |
| Buchanan Sharon | $181,000 | -- |
Source: Public Records
Mortgage History
| Date | Status | Borrower | Loan Amount |
|---|---|---|---|
| Open | Deoliveira Jumar | $425,250 | |
| Previous Owner | Gulla Richard | $256,000 | |
| Previous Owner | Buchanan Sharon | $100,000 |
Source: Public Records
Tax History Compared to Growth
Tax History
| Year | Tax Paid | Tax Assessment Tax Assessment Total Assessment is a certain percentage of the fair market value that is determined by local assessors to be the total taxable value of land and additions on the property. | Land | Improvement |
|---|---|---|---|---|
| 2025 | $6,746 | $527,000 | $222,300 | $304,700 |
| 2024 | $6,737 | $506,900 | $213,600 | $293,300 |
| 2023 | $6,420 | $444,300 | $185,000 | $259,300 |
| 2022 | $6,162 | $400,400 | $169,700 | $230,700 |
| 2021 | $5,954 | $372,600 | $169,700 | $202,900 |
| 2020 | $5,892 | $369,200 | $169,700 | $199,500 |
| 2019 | $5,777 | $349,300 | $169,700 | $179,600 |
| 2018 | $5,713 | $345,000 | $165,400 | $179,600 |
| 2017 | $5,564 | $331,400 | $165,400 | $166,000 |
| 2016 | $5,510 | $320,700 | $165,400 | $155,300 |
| 2015 | $5,391 | $307,200 | $156,700 | $150,500 |
Source: Public Records
Map
Nearby Homes
- 33 Brown Bear Ln Unit 33
- 10 Black Bear Unit 10
- 11 Black Bear Unit 11
- 9 Black Bear Cir Unit 9
- 7 Black Bear Unit 7
- 3 Black Bear Cir Unit 3
- 43 Black Bear Cir Unit 43
- 48 Black Bear Cir Unit 48
- 9 Hillside Ave
- 35 Woodland Ave Unit 35A
- 3 S Central St
- 23 Christina Rd
- 97 E Street Extension
- 57 Beach St
- 17 Middleton St
- 55 Jefferson St
- 30 Whitney St
- 15 Free St
- 102-104 Central St
- 56 S Bow St