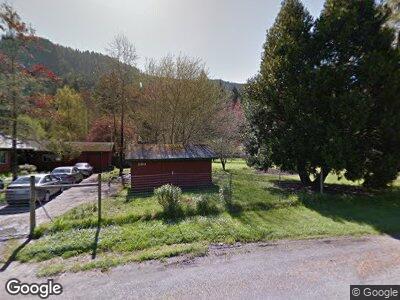
390 Golden Gate Dr Carlotta, CA 95528
Estimated Value: $353,000 - $456,000
4
Beds
1
Bath
1,850
Sq Ft
$218/Sq Ft
Est. Value
About This Home
This home is located at 390 Golden Gate Dr, Carlotta, CA 95528 and is currently estimated at $403,727, approximately $218 per square foot. 390 Golden Gate Dr is a home located in Humboldt County with nearby schools including Bridgeville Elementary School, Fortuna Union High School, and East High School.
Ownership History
Date
Name
Owned For
Owner Type
Purchase Details
Closed on
Jun 21, 2004
Sold by
Huston Michael L and Huston Marla S
Bought by
Katzdorn Randall S and Katzdorn Linda
Current Estimated Value
Home Financials for this Owner
Home Financials are based on the most recent Mortgage that was taken out on this home.
Original Mortgage
$209,250
Interest Rate
6.17%
Mortgage Type
Purchase Money Mortgage
Purchase Details
Closed on
May 18, 2001
Sold by
Littlefield John E and Littlefield Deborah L
Bought by
Huston Michael L and Huston Marla S
Home Financials for this Owner
Home Financials are based on the most recent Mortgage that was taken out on this home.
Original Mortgage
$154,000
Interest Rate
7.14%
Create a Home Valuation Report for This Property
The Home Valuation Report is an in-depth analysis detailing your home's value as well as a comparison with similar homes in the area
Home Values in the Area
Average Home Value in this Area
Purchase History
| Date | Buyer | Sale Price | Title Company |
|---|---|---|---|
| Katzdorn Randall S | $279,000 | First American Title Ins Co | |
| Huston Michael L | $172,000 | Fidelity National Title Co |
Source: Public Records
Mortgage History
| Date | Status | Borrower | Loan Amount |
|---|---|---|---|
| Open | Katzdorn Randall S | $272,000 | |
| Closed | Katzdom Ranadll S | $272,000 | |
| Closed | Katzdorn Randall S | $304,000 | |
| Previous Owner | Katzdorn Randall S | $209,250 | |
| Previous Owner | Huston Michael L | $184,000 | |
| Previous Owner | Huston Michael L | $25,000 | |
| Previous Owner | Huston Michael L | $154,000 | |
| Previous Owner | Littlefield John E | $42,200 | |
| Previous Owner | Littlefield John E | $116,250 | |
| Previous Owner | Littlefield John E | $19,000 | |
| Closed | Katzdorn Randall S | $52,300 |
Source: Public Records
Tax History Compared to Growth
Tax History
| Year | Tax Paid | Tax Assessment Tax Assessment Total Assessment is a certain percentage of the fair market value that is determined by local assessors to be the total taxable value of land and additions on the property. | Land | Improvement |
|---|---|---|---|---|
| 2024 | $3,911 | $381,254 | $136,646 | $244,608 |
| 2023 | $3,875 | $373,779 | $133,967 | $239,812 |
| 2022 | $3,842 | $366,451 | $131,341 | $235,110 |
| 2021 | $3,721 | $359,266 | $128,766 | $230,500 |
| 2020 | $3,714 | $355,583 | $127,446 | $228,137 |
| 2019 | $3,577 | $348,612 | $124,948 | $223,664 |
| 2018 | $3,503 | $341,778 | $122,499 | $219,279 |
| 2017 | $3,438 | $335,078 | $120,098 | $214,980 |
| 2016 | $3,370 | $328,509 | $117,744 | $210,765 |
| 2015 | $3,336 | $323,576 | $115,976 | $207,600 |
| 2014 | $3,243 | $317,239 | $113,705 | $203,534 |
Source: Public Records
Map
Nearby Homes
- 599 Golden Gate Dr
- 661 Golden Gate Dr
- 38819 Kneeland Rd
- 18972 California 36
- 3252 Little Larabee Crk Rd
- 29860 State Highway 36
- 105 Cottrell Rd
- 32530 California 36
- 353 Holmes Flat Rd
- 000 Holmes Flat Rd
- 40500 Alderpoint Rd
- 137 Railroad Ave
- 282 Sorenson Rd
- 33433 California 36
- 5684 Cummings Creek Rd
- 800 Riverside Park Rd
- 595 Riverside Park Rd
- 67 Kirk Ct
- 11 Hidden Valley Rd
- 1174 Cummings Creek Rd