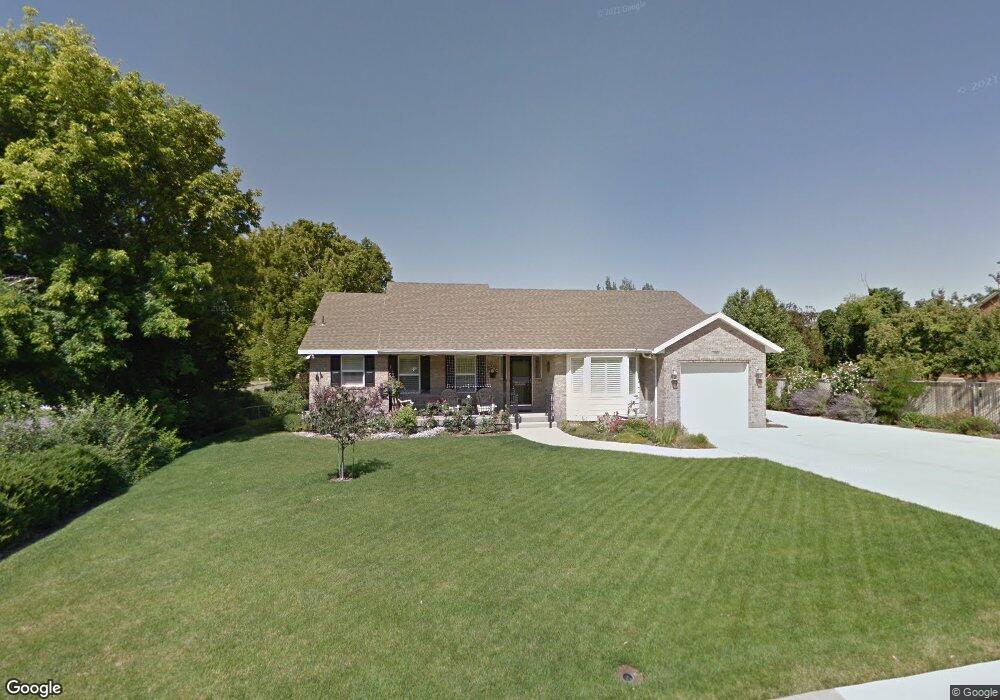
390 S 200 E Centerville, UT 84014
Estimated Value: $506,000 - $698,000
2
Beds
2
Baths
1,472
Sq Ft
$402/Sq Ft
Est. Value
About This Home
This home is located at 390 S 200 E, Centerville, UT 84014 and is currently estimated at $591,257, approximately $401 per square foot. 390 S 200 E is a home located in Davis County with nearby schools including J A Taylor Elementary School, Centerville Jr High, and Viewmont High School.
Ownership History
Date
Name
Owned For
Owner Type
Purchase Details
Closed on
Jul 18, 2007
Sold by
Mitchell Lynn R and Mitchell Linda
Bought by
Mitchell Lynn R and Mitchell Linda
Current Estimated Value
Home Financials for this Owner
Home Financials are based on the most recent Mortgage that was taken out on this home.
Original Mortgage
$47,700
Interest Rate
6.51%
Mortgage Type
New Conventional
Purchase Details
Closed on
Nov 7, 2006
Sold by
Mitchell Lynn R and Mitchell Linda
Bought by
Mitchell Lynn R and Mitchell Linda
Home Financials for this Owner
Home Financials are based on the most recent Mortgage that was taken out on this home.
Original Mortgage
$221,700
Interest Rate
6.3%
Mortgage Type
New Conventional
Purchase Details
Closed on
Feb 20, 1996
Sold by
Mitchell Lynn R and Mitchell Linda
Bought by
Mitchell Lynn R and Mitchell Linda
Create a Home Valuation Report for This Property
The Home Valuation Report is an in-depth analysis detailing your home's value as well as a comparison with similar homes in the area
Purchase History
| Date | Buyer | Sale Price | Title Company |
|---|---|---|---|
| Mitchell Lynn R | -- | First American Title | |
| Mitchell Lynn R | -- | First American Title | |
| Mitchell Lynn R | -- | -- |
Source: Public Records
Mortgage History
| Date | Status | Borrower | Loan Amount |
|---|---|---|---|
| Closed | Mitchell Lynn R | $47,700 | |
| Closed | Mitchell Lynn R | $221,700 |
Source: Public Records
Tax History
| Year | Tax Paid | Tax Assessment Tax Assessment Total Assessment is a certain percentage of the fair market value that is determined by local assessors to be the total taxable value of land and additions on the property. | Land | Improvement |
|---|---|---|---|---|
| 2025 | $3,312 | $316,800 | $173,474 | $143,326 |
| 2024 | $3,172 | $308,550 | $160,601 | $147,949 |
| 2023 | $3,072 | $540,000 | $257,280 | $282,720 |
| 2022 | $3,256 | $315,150 | $131,159 | $183,991 |
| 2021 | $2,984 | $450,000 | $207,254 | $242,746 |
| 2020 | $2,594 | $391,000 | $198,528 | $192,472 |
| 2019 | $2,635 | $388,000 | $187,505 | $200,495 |
| 2018 | $2,475 | $360,000 | $172,661 | $187,339 |
| 2016 | $2,006 | $162,140 | $64,825 | $97,315 |
| 2015 | $1,953 | $148,940 | $64,825 | $84,115 |
| 2014 | $1,894 | $147,811 | $64,825 | $82,986 |
| 2013 | -- | $141,745 | $45,375 | $96,370 |
Source: Public Records
Map
Nearby Homes
- 150 E 735 S Unit 23
- 495 E 475 S
- 328 E 1100 S
- 16 S 200 E
- 16 W 780 S
- 360 E Center St
- 88 W 50 S Unit C-3
- 88 W 50 S Unit B5
- 462 Pitford Dr
- 967 S Courtyard Ln
- 330 W Paradiso Ln
- 96 Village Square Rd
- 56 W 200 N
- 951 Centerville Commons Way
- 2 S 285 W
- 252 N 400 E
- 610 S 800 E
- 610 E Pages Ln
- 147 N 360 W Unit 21
- 204 Lyman Ln
Your Personal Tour Guide
Ask me questions while you tour the home.