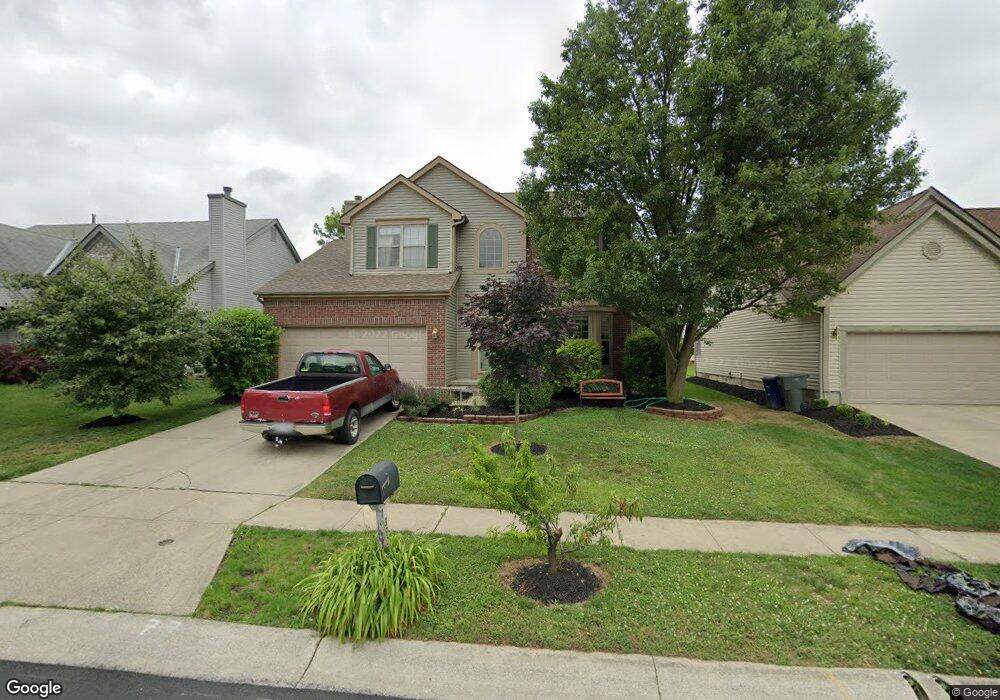
3900 Poplar Bend Dr Columbus, OH 43204
Brookhollow NeighborhoodEstimated Value: $377,000 - $414,000
4
Beds
3
Baths
2,118
Sq Ft
$185/Sq Ft
Est. Value
About This Home
This home is located at 3900 Poplar Bend Dr, Columbus, OH 43204 and is currently estimated at $390,780, approximately $184 per square foot. 3900 Poplar Bend Dr is a home located in Franklin County with nearby schools including Beacon Elementary School, Hilliard Tharp Sixth Grade Elementary School, and Hilliard Weaver Middle School.
Ownership History
Date
Name
Owned For
Owner Type
Purchase Details
Closed on
Aug 30, 2005
Sold by
Fan Ma Manhong and Fan Gui
Bought by
Nelli James E and Nelli Rachel W
Current Estimated Value
Home Financials for this Owner
Home Financials are based on the most recent Mortgage that was taken out on this home.
Original Mortgage
$153,600
Outstanding Balance
$82,589
Interest Rate
5.93%
Mortgage Type
Purchase Money Mortgage
Estimated Equity
$308,191
Purchase Details
Closed on
Sep 18, 2002
Sold by
Parisi Michael J and Parisi Tiffany S
Bought by
Pan Ma Manhong and Pan Gui
Home Financials for this Owner
Home Financials are based on the most recent Mortgage that was taken out on this home.
Original Mortgage
$148,700
Interest Rate
6.39%
Mortgage Type
Purchase Money Mortgage
Purchase Details
Closed on
Jul 10, 1996
Sold by
Homewood Building Co
Bought by
Michael J Parisi
Create a Home Valuation Report for This Property
The Home Valuation Report is an in-depth analysis detailing your home's value as well as a comparison with similar homes in the area
Home Values in the Area
Average Home Value in this Area
Purchase History
| Date | Buyer | Sale Price | Title Company |
|---|---|---|---|
| Nelli James E | $192,000 | Title First | |
| Pan Ma Manhong | $175,000 | Real Living Title | |
| Michael J Parisi | $142,150 | -- |
Source: Public Records
Mortgage History
| Date | Status | Borrower | Loan Amount |
|---|---|---|---|
| Open | Nelli James E | $153,600 | |
| Closed | Pan Ma Manhong | $148,700 |
Source: Public Records
Tax History Compared to Growth
Tax History
| Year | Tax Paid | Tax Assessment Tax Assessment Total Assessment is a certain percentage of the fair market value that is determined by local assessors to be the total taxable value of land and additions on the property. | Land | Improvement |
|---|---|---|---|---|
| 2024 | $5,367 | $95,030 | $18,200 | $76,830 |
| 2023 | $4,650 | $95,025 | $18,200 | $76,825 |
| 2022 | $5,336 | $87,330 | $15,720 | $71,610 |
| 2021 | $5,631 | $87,330 | $15,720 | $71,610 |
| 2020 | $5,316 | $87,330 | $15,720 | $71,610 |
| 2019 | $4,876 | $68,400 | $12,570 | $55,830 |
| 2018 | $4,718 | $68,400 | $12,570 | $55,830 |
| 2017 | $4,856 | $68,400 | $12,570 | $55,830 |
| 2016 | $4,744 | $61,890 | $12,080 | $49,810 |
| 2015 | $4,579 | $61,890 | $12,080 | $49,810 |
| 2014 | $4,454 | $61,890 | $12,080 | $49,810 |
| 2013 | $2,323 | $61,880 | $12,075 | $49,805 |
Source: Public Records
Map
Nearby Homes
- 4106 Ongaro Dr
- 4000 Sandy Ridge Dr
- 1664 Demaret Ln
- 1272 Deer Lake Ct
- 3734 Gibbstone Dr
- 3636 Whitworth Way
- 4381 Alderson Ct
- 3480 Inkster Dr
- 3500 Rosburg Dr
- 4719 Trabue Woods Ct
- 1395 Dillingham Ct
- 3493 En Joie Dr
- 3254 Dover Rd
- 3252 Dover Rd
- 4451 Sherwill Rd
- 1331 Kellerman Ct
- 4457 Nickerson Rd
- 3310 Colony Hill Ln
- 3187 El Greco Dr
- 3161 Bowdoin Cir
- 3892 Poplar Bend Dr
- 3906 Poplar Bend Dr
- 3886 Poplar Bend Dr
- 3912 Poplar Bend Dr
- 3899 Basia Dr
- 3907 Basia Dr
- 3891 Basia Dr
- 3915 Basia Dr
- 3880 Poplar Bend Dr
- 3918 Poplar Bend Dr
- 3899 Poplar Bend Dr
- 3883 Basia Dr
- 3893 Poplar Bend Dr
- 3905 Poplar Bend Dr
- 3923 Basia Dr
- 3887 Poplar Bend Dr
- 3911 Poplar Bend Dr
- 3924 Poplar Bend Dr
- 3881 Poplar Bend Dr
- 1515 Raspberry Run Dr