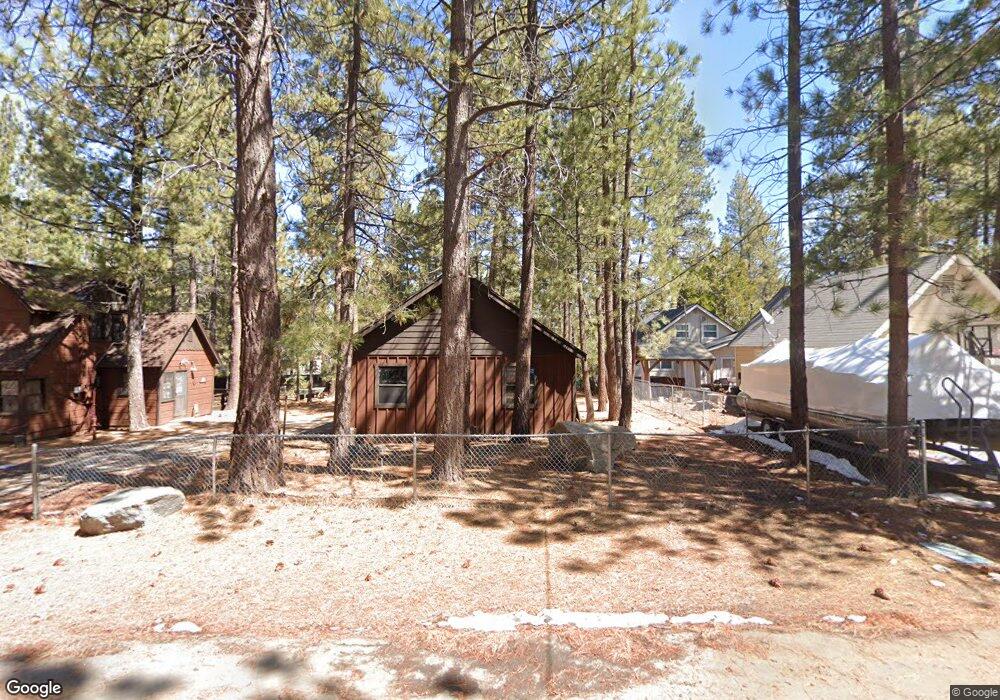
39008 Robin Rd Big Bear Lake, CA 92315
Estimated Value: $385,000 - $444,000
1
Bed
1
Bath
720
Sq Ft
$571/Sq Ft
Est. Value
About This Home
This home is located at 39008 Robin Rd, Big Bear Lake, CA 92315 and is currently estimated at $411,162, approximately $571 per square foot. 39008 Robin Rd is a home with nearby schools including Big Bear Middle School and Big Bear High School.
Ownership History
Date
Name
Owned For
Owner Type
Purchase Details
Closed on
Dec 21, 2012
Sold by
Hooyenga James J and Hooyenga Mary Louise
Bought by
Nydam Donald J and The Nydam Family Decedents Tru
Current Estimated Value
Purchase Details
Closed on
Mar 13, 2007
Sold by
J & D Properties
Bought by
Hooyenga James J and Hooyenga Mary Louise
Home Financials for this Owner
Home Financials are based on the most recent Mortgage that was taken out on this home.
Original Mortgage
$248,000
Interest Rate
5.75%
Mortgage Type
Purchase Money Mortgage
Purchase Details
Closed on
Nov 25, 2003
Sold by
J & D Properties
Bought by
Nydam Donald J and Nydam Esther Rose
Home Financials for this Owner
Home Financials are based on the most recent Mortgage that was taken out on this home.
Original Mortgage
$150,000
Interest Rate
6.5%
Mortgage Type
Purchase Money Mortgage
Create a Home Valuation Report for This Property
The Home Valuation Report is an in-depth analysis detailing your home's value as well as a comparison with similar homes in the area
Home Values in the Area
Average Home Value in this Area
Purchase History
| Date | Buyer | Sale Price | Title Company |
|---|---|---|---|
| Nydam Donald J | -- | None Available | |
| Hooyenga James J | -- | Natc | |
| Nydam Donald J | -- | Ticor Title Co |
Source: Public Records
Mortgage History
| Date | Status | Borrower | Loan Amount |
|---|---|---|---|
| Previous Owner | Hooyenga James J | $248,000 | |
| Previous Owner | Nydam Donald J | $150,000 |
Source: Public Records
Tax History
| Year | Tax Paid | Tax Assessment Tax Assessment Total Assessment is a certain percentage of the fair market value that is determined by local assessors to be the total taxable value of land and additions on the property. | Land | Improvement |
|---|---|---|---|---|
| 2025 | $4,574 | $306,767 | $105,974 | $200,793 |
| 2024 | $4,419 | $300,752 | $103,896 | $196,856 |
| 2023 | $4,262 | $294,855 | $101,859 | $192,996 |
| 2022 | $4,067 | $289,074 | $99,862 | $189,212 |
| 2021 | $3,944 | $283,406 | $97,904 | $185,502 |
| 2020 | $3,984 | $280,500 | $96,900 | $183,600 |
| 2019 | $3,891 | $275,000 | $95,000 | $180,000 |
| 2018 | $3,656 | $259,744 | $108,226 | $151,518 |
| 2017 | $3,561 | $254,651 | $106,104 | $148,547 |
| 2016 | $3,484 | $249,658 | $104,024 | $145,634 |
| 2015 | $3,455 | $245,907 | $102,461 | $143,446 |
| 2014 | $3,397 | $241,090 | $100,454 | $140,636 |
Source: Public Records
Map
Nearby Homes
- 38992 Bayview Ln
- 39080 Waterview Dr
- 39039 Bayview Ln
- 38994 Willow Landing Rd
- 39161 Buckthorn Rd
- 39036 Willow Landing Rd
- 39056 Willow Landing Rd
- 39196 Starview Ln
- 39104 Willow Landing Rd
- 541 Timber Ln
- 39187 N Bay Dr
- 368 Pulaski Rd
- 368 Pulaski Rd
- 612 Timber Ln
- 547 Chipmunk Ln
- 543 Chipmunk Ln
- 39243 Crest Ln
- 760 Blue Jay Rd Unit 34
- 760 Blue Jay Rd Unit 44
- 39069 Big Bear Blvd
- 39016 Robin Rd
- 39000 Robin Rd
- 39026 Robin Rd
- 39039 Waterview Dr
- 39023 Waterview Dr
- 507 Woodland Way
- 39011 Waterview Dr
- 39038 Robin Rd
- 39005 Robin Rd
- 39031 Waterview Dr
- 39011 Robin Rd
- 38995 Robin Rd
- 39021 Robin Rd
- 39046 Robin Rd
- 39029 Robin Rd
- 510 Blue Jay Rd
- 499 Woodland Way
- 530 Blue Jay Rd
- 39041 Robin Rd
- 39054 Robin Rd
Your Personal Tour Guide
Ask me questions while you tour the home.