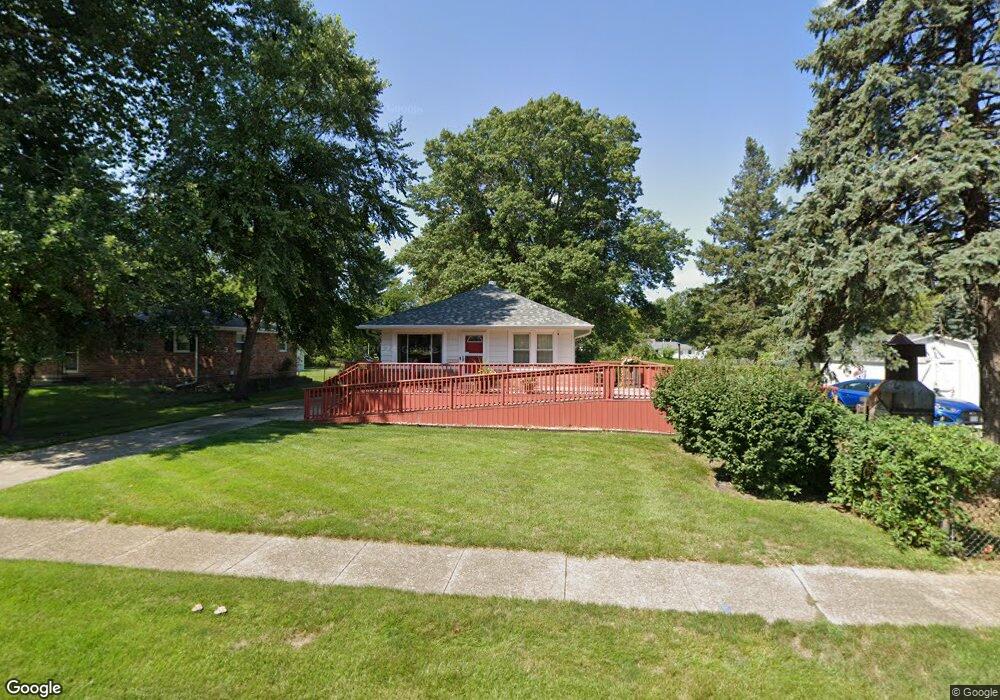
3902 40th St Des Moines, IA 50310
Lower Beaver NeighborhoodEstimated Value: $224,000 - $240,446
2
Beds
1
Bath
1,056
Sq Ft
$219/Sq Ft
Est. Value
About This Home
This home is located at 3902 40th St, Des Moines, IA 50310 and is currently estimated at $231,612, approximately $219 per square foot. 3902 40th St is a home located in Polk County with nearby schools including Samuelson Elementary School, Meredith Middle School, and Hoover High School.
Ownership History
Date
Name
Owned For
Owner Type
Purchase Details
Closed on
Jul 12, 2011
Sold by
S C I F L Charity Inc
Bought by
S C I F L Charity Inc
Current Estimated Value
Purchase Details
Closed on
Oct 1, 2003
Sold by
Taylor John E
Bought by
Anderson Robert Gary and Anderson Lavonne C
Home Financials for this Owner
Home Financials are based on the most recent Mortgage that was taken out on this home.
Original Mortgage
$91,200
Interest Rate
6.4%
Mortgage Type
Purchase Money Mortgage
Create a Home Valuation Report for This Property
The Home Valuation Report is an in-depth analysis detailing your home's value as well as a comparison with similar homes in the area
Home Values in the Area
Average Home Value in this Area
Purchase History
| Date | Buyer | Sale Price | Title Company |
|---|---|---|---|
| S C I F L Charity Inc | -- | None Available | |
| Anderson Robert Gary | $114,000 | -- |
Source: Public Records
Mortgage History
| Date | Status | Borrower | Loan Amount |
|---|---|---|---|
| Previous Owner | Anderson Robert Gary | $91,200 |
Source: Public Records
Tax History
| Year | Tax Paid | Tax Assessment Tax Assessment Total Assessment is a certain percentage of the fair market value that is determined by local assessors to be the total taxable value of land and additions on the property. | Land | Improvement |
|---|---|---|---|---|
| 2025 | $3,808 | $228,300 | $91,600 | $136,700 |
| 2024 | $3,808 | $204,000 | $81,600 | $122,400 |
| 2023 | $3,818 | $204,000 | $81,600 | $122,400 |
| 2022 | $3,788 | $162,000 | $68,200 | $93,800 |
| 2021 | $3,836 | $162,000 | $68,200 | $93,800 |
| 2020 | $3,984 | $153,700 | $64,900 | $88,800 |
| 2019 | $3,674 | $153,700 | $64,900 | $88,800 |
| 2018 | $3,636 | $136,700 | $57,400 | $79,300 |
| 2017 | $3,242 | $136,700 | $57,400 | $79,300 |
| 2016 | $3,160 | $119,900 | $49,800 | $70,100 |
| 2015 | $3,160 | $119,900 | $49,800 | $70,100 |
| 2014 | $3,140 | $118,200 | $48,800 | $69,400 |
Source: Public Records
Map
Nearby Homes