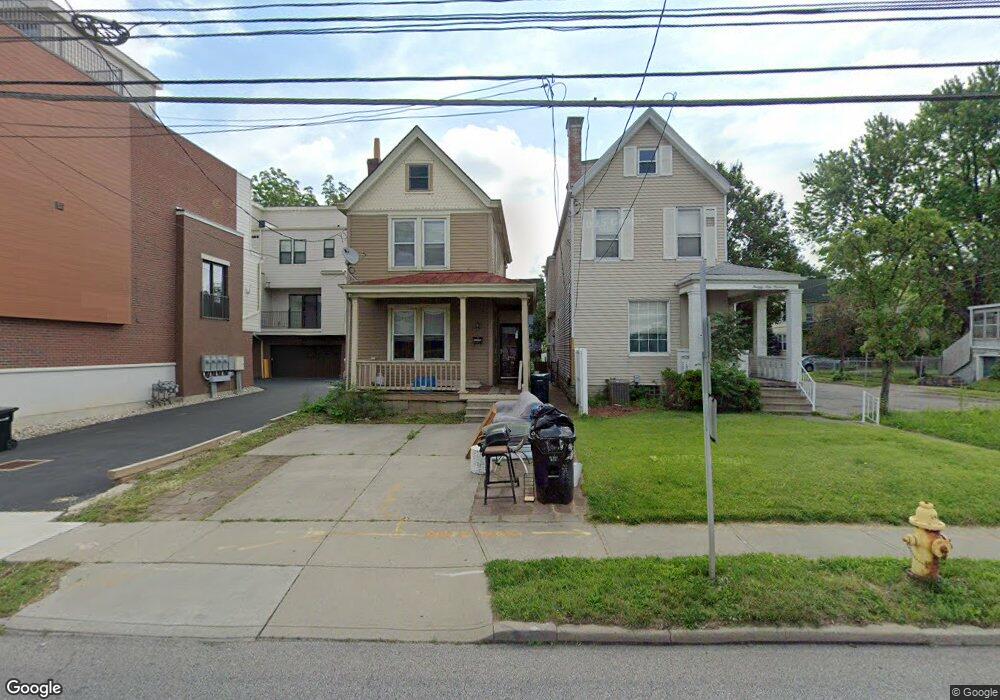
3902 Edwards Rd Cincinnati, OH 45209
Estimated Value: $306,000 - $373,000
2
Beds
1
Bath
1,368
Sq Ft
$242/Sq Ft
Est. Value
About This Home
This home is located at 3902 Edwards Rd, Cincinnati, OH 45209 and is currently estimated at $330,381, approximately $241 per square foot. 3902 Edwards Rd is a home located in Hamilton County with nearby schools including Withrow University High School, Clark Montessori High School, and Shroder High School.
Ownership History
Date
Name
Owned For
Owner Type
Purchase Details
Closed on
Sep 26, 2013
Sold by
Burton Matthew F and Ichikawa Burton Sanae
Bought by
Mfb Properties Llc
Current Estimated Value
Purchase Details
Closed on
Dec 7, 1998
Sold by
Bradford Michael J and Bradford Cecelia B
Bought by
Burton Matthew F
Home Financials for this Owner
Home Financials are based on the most recent Mortgage that was taken out on this home.
Original Mortgage
$58,800
Interest Rate
6.95%
Purchase Details
Closed on
Sep 14, 1995
Sold by
Bradford Michael J and Bradford Cecelia B
Bought by
Hubble Steven E and Hubble Kimberly B
Home Financials for this Owner
Home Financials are based on the most recent Mortgage that was taken out on this home.
Original Mortgage
$62,000
Interest Rate
7.78%
Create a Home Valuation Report for This Property
The Home Valuation Report is an in-depth analysis detailing your home's value as well as a comparison with similar homes in the area
Home Values in the Area
Average Home Value in this Area
Purchase History
| Date | Buyer | Sale Price | Title Company |
|---|---|---|---|
| Mfb Properties Llc | -- | None Available | |
| Burton Matthew F | $73,500 | Vintage Title Agency Inc | |
| Hubble Steven E | -- | -- |
Source: Public Records
Mortgage History
| Date | Status | Borrower | Loan Amount |
|---|---|---|---|
| Previous Owner | Burton Matthew F | $58,800 | |
| Previous Owner | Hubble Steven E | $62,000 |
Source: Public Records
Tax History
| Year | Tax Paid | Tax Assessment Tax Assessment Total Assessment is a certain percentage of the fair market value that is determined by local assessors to be the total taxable value of land and additions on the property. | Land | Improvement |
|---|---|---|---|---|
| 2025 | $4,789 | $75,562 | $34,682 | $40,880 |
| 2024 | $4,782 | $75,562 | $34,682 | $40,880 |
| 2023 | $4,790 | $75,562 | $34,682 | $40,880 |
| 2022 | $5,367 | $76,189 | $33,254 | $42,935 |
| 2021 | $5,277 | $76,189 | $33,254 | $42,935 |
| 2020 | $5,292 | $76,189 | $33,254 | $42,935 |
| 2019 | $5,055 | $66,252 | $28,917 | $37,335 |
| 2018 | $5,059 | $66,252 | $28,917 | $37,335 |
| 2017 | $4,873 | $66,252 | $28,917 | $37,335 |
| 2016 | $4,106 | $54,436 | $24,721 | $29,715 |
| 2015 | $3,670 | $54,436 | $24,721 | $29,715 |
| 2014 | $3,689 | $54,436 | $24,721 | $29,715 |
| 2013 | $3,443 | $49,942 | $22,680 | $27,262 |
Source: Public Records
Map
Nearby Homes
- 2711 Hyde Park Ave
- 3912 Edwards Rd
- 3908 Edwards Rd
- 2724 Markbreit Ave
- 2718 Minot Ave
- 2711 Arbor Ave
- 2844 Markbreit Ave
- 2604 Melrose Ave
- 2913 Madison Rd
- 3759 Andrew Ave
- 4311 Beech St
- 3767 Hyde Park Ave
- 3847 Drake Ave
- 4211 Smith Rd
- 2619 Leslie Ave
- 4308 Smith Rd
- 3648 Michigan Ave
- 2620 Leslie Ave
- 3666 Burch Ave
- 4317 Smith Rd
- 3900 Edwards Rd
- 3904 Edwards Rd
- 3904 Edwards Rd Unit 7
- 3904 Edwards Rd Unit 6
- 3904 Edwards Rd Unit 5
- 3904 Edwards Rd Unit 4
- 3904 Edwards Rd Unit 3
- 3904 Edwards Rd Unit 2
- 3904 Edwards Rd Unit 1
- 3906 Edwards Rd Unit D
- 3906 Edwards Rd Unit 5
- 2712 Atlantic Ave
- 3908 Edwards Rd
- 3908 Edwards Rd Unit B
- 3908 Edwards Rd Unit 5
- 3908 Edwards Rd Unit 4
- 3908 Edwards Rd Unit 3
- 3908 Edwards Rd Unit 2
- 3908 Edwards Rd Unit 7
- 3908 Edwards Rd Unit 6
Your Personal Tour Guide
Ask me questions while you tour the home.