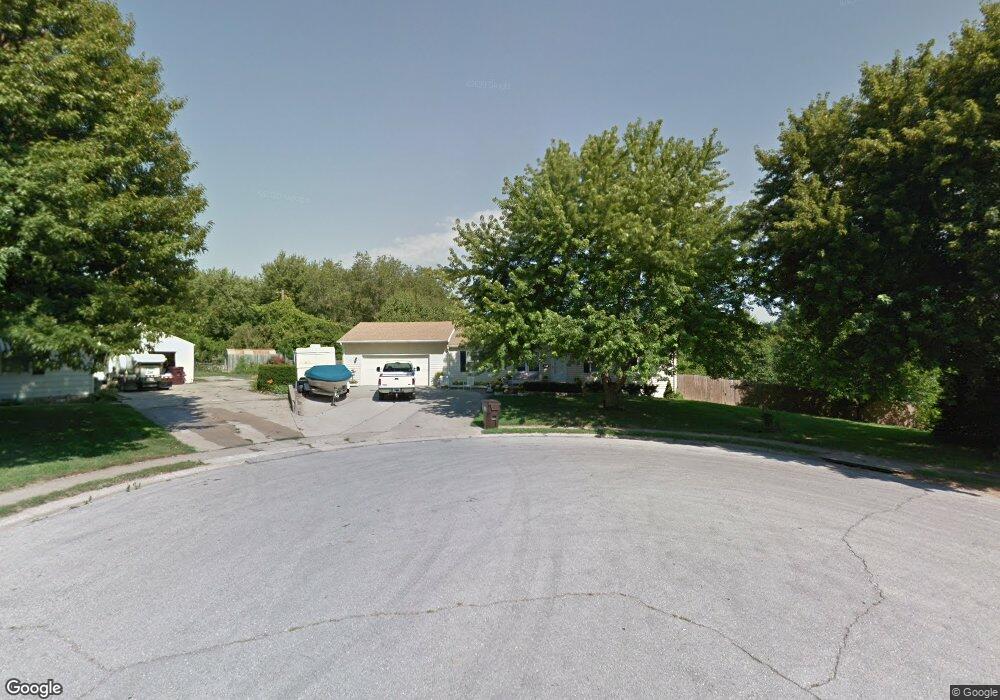
3902 N Delaware St Independence, MO 64050
Kentucky Hills NeighborhoodEstimated Value: $204,064 - $214,000
3
Beds
1
Bath
1,401
Sq Ft
$150/Sq Ft
Est. Value
About This Home
This home is located at 3902 N Delaware St, Independence, MO 64050 and is currently estimated at $209,516, approximately $149 per square foot. 3902 N Delaware St is a home located in Jackson County with nearby schools including Mill Creek Elementary School, Bridger Middle School, and Bingham Middle School.
Ownership History
Date
Name
Owned For
Owner Type
Purchase Details
Closed on
Feb 2, 2017
Sold by
Silver Fern Properties Llc
Bought by
Cirrus Housing Llc
Current Estimated Value
Purchase Details
Closed on
Jan 24, 2017
Sold by
Titus Raymond E
Bought by
Silver Fern Properties Llc
Purchase Details
Closed on
Jun 20, 2016
Sold by
Hillyard Lori A and Titus Lori A
Bought by
Titus Raymond E
Purchase Details
Closed on
Jun 5, 2013
Sold by
Titus Russel L and Titus Melody
Bought by
Titus Raymond E and Titus Lori A
Purchase Details
Closed on
Aug 4, 2006
Sold by
Spencer Douglas Martin and Spencer Rhonda R
Bought by
Titus Raymond E and Titus Lori A
Home Financials for this Owner
Home Financials are based on the most recent Mortgage that was taken out on this home.
Original Mortgage
$85,000
Interest Rate
6.66%
Mortgage Type
Construction
Create a Home Valuation Report for This Property
The Home Valuation Report is an in-depth analysis detailing your home's value as well as a comparison with similar homes in the area
Home Values in the Area
Average Home Value in this Area
Purchase History
| Date | Buyer | Sale Price | Title Company |
|---|---|---|---|
| Cirrus Housing Llc | -- | Stewart Title Company | |
| Silver Fern Properties Llc | -- | Accommodation | |
| Titus Raymond E | -- | None Available | |
| Titus Raymond E | -- | None Available | |
| Titus Raymond E | -- | Capital Title Agency Inc |
Source: Public Records
Mortgage History
| Date | Status | Borrower | Loan Amount |
|---|---|---|---|
| Previous Owner | Titus Raymond E | $85,000 |
Source: Public Records
Tax History
| Year | Tax Paid | Tax Assessment Tax Assessment Total Assessment is a certain percentage of the fair market value that is determined by local assessors to be the total taxable value of land and additions on the property. | Land | Improvement |
|---|---|---|---|---|
| 2025 | $1,964 | $26,885 | $3,916 | $22,969 |
| 2024 | $1,919 | $28,344 | $3,585 | $24,759 |
| 2023 | $1,919 | $28,345 | $3,124 | $25,221 |
| 2022 | $1,502 | $20,330 | $1,955 | $18,375 |
| 2021 | $1,501 | $20,330 | $1,955 | $18,375 |
| 2020 | $1,385 | $18,226 | $1,955 | $16,271 |
| 2019 | $1,363 | $18,226 | $1,955 | $16,271 |
| 2018 | $730,078 | $15,862 | $1,701 | $14,161 |
| 2016 | $1,736 | $15,464 | $3,914 | $11,550 |
Source: Public Records
Map
Nearby Homes
- 3509 N Mccoy St
- 3801 N Osage St
- 3302 N Delaware St
- 3303 N Mccoy St
- 3015 Cement City Rd
- 503 W Colonel Dr
- 303 W Marcia Ave
- 2910 N River Terrace
- 2402 N Liberty St
- 2806 N River Blvd
- 14500 E Kentucky Rd
- 13212 Kemper Ct
- 822 Dickinson Rd
- 915 Dickinson Rd
- 11534 Gill St
- 0 N Allen Rd
- 11814 E Scarritt Ave
- 11813 & 11815 E Scarritt Ave
- 711 W Jones St
- 11610 Hackett St
- 3905 N Delaware St
- 3900 N Delaware St
- 3901 N Delaware St
- 3808 N Delaware St
- 3905 N Union St
- 3903 N Union St
- 3907 N Union St
- 3806 N Delaware St
- 804 W 39th St N
- 3901 N Union St
- 807 W 39th St N
- 3807 N Union St
- 3804 N Delaware St
- 13004 E Kentucky Rd
- 800 W 39th St North N A
- 3908 N Union St
- 800 W 39 St N
- 3805 N Union St
- 3904 N Union St
- 800 W 39th St N
Your Personal Tour Guide
Ask me questions while you tour the home.