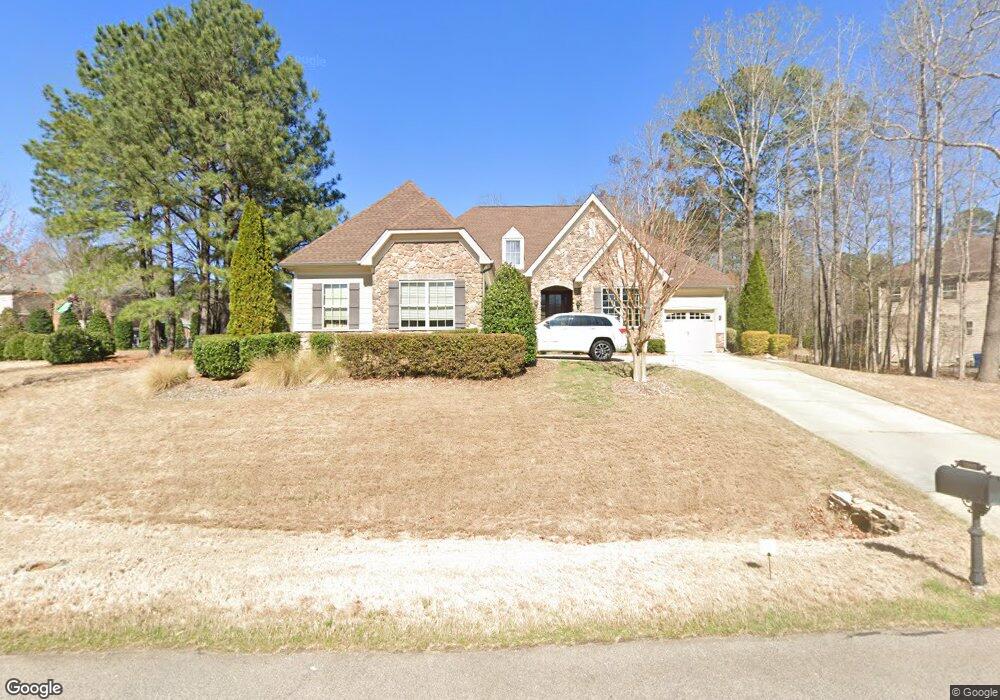
3909 Colinwood Ln Raleigh, NC 27606
Middle Creek NeighborhoodEstimated Value: $942,094 - $1,038,000
4
Beds
4
Baths
3,198
Sq Ft
$312/Sq Ft
Est. Value
About This Home
This home is located at 3909 Colinwood Ln, Raleigh, NC 27606 and is currently estimated at $998,774, approximately $312 per square foot. 3909 Colinwood Ln is a home located in Wake County with nearby schools including Swift Creek Elementary School, Dillard Drive Magnet Middle School, and Resurrection Lutheran School.
Ownership History
Date
Name
Owned For
Owner Type
Purchase Details
Closed on
Nov 19, 2020
Sold by
Lloyd Dennis Earl and Hall Lloyd Anna
Bought by
Boyle Patrick James and Boyle Judith K
Current Estimated Value
Home Financials for this Owner
Home Financials are based on the most recent Mortgage that was taken out on this home.
Original Mortgage
$510,400
Outstanding Balance
$454,183
Interest Rate
2.8%
Mortgage Type
New Conventional
Estimated Equity
$544,591
Purchase Details
Closed on
Jun 17, 2015
Sold by
Martin Gregory P and Martin Sharon H
Bought by
Lloyd Dennis Earl and Hall Lloyd Anan Marie
Home Financials for this Owner
Home Financials are based on the most recent Mortgage that was taken out on this home.
Original Mortgage
$500,000
Interest Rate
3.93%
Mortgage Type
New Conventional
Purchase Details
Closed on
Oct 25, 2012
Bought by
Martin Gregory P and Martin Sharon H
Purchase Details
Closed on
Nov 30, 2010
Sold by
Rkl Of Nc Llc
Bought by
Toll Nc L P
Create a Home Valuation Report for This Property
The Home Valuation Report is an in-depth analysis detailing your home's value as well as a comparison with similar homes in the area
Home Values in the Area
Average Home Value in this Area
Purchase History
| Date | Buyer | Sale Price | Title Company |
|---|---|---|---|
| Boyle Patrick James | $670,000 | None Available | |
| Lloyd Dennis Earl | $625,000 | Attorney | |
| Martin Gregory P | $510,000 | -- | |
| Toll Nc L P | $448,000 | None Available |
Source: Public Records
Mortgage History
| Date | Status | Borrower | Loan Amount |
|---|---|---|---|
| Open | Boyle Patrick James | $510,400 | |
| Previous Owner | Lloyd Dennis Earl | $500,000 |
Source: Public Records
Tax History Compared to Growth
Tax History
| Year | Tax Paid | Tax Assessment Tax Assessment Total Assessment is a certain percentage of the fair market value that is determined by local assessors to be the total taxable value of land and additions on the property. | Land | Improvement |
|---|---|---|---|---|
| 2025 | $5,457 | $850,131 | $170,000 | $680,131 |
| 2024 | $5,299 | $850,131 | $170,000 | $680,131 |
| 2023 | $5,018 | $641,032 | $110,000 | $531,032 |
| 2022 | $4,650 | $641,032 | $110,000 | $531,032 |
| 2021 | $4,525 | $641,032 | $110,000 | $531,032 |
| 2020 | $3,792 | $641,032 | $110,000 | $531,032 |
| 2019 | $4,877 | $594,688 | $110,000 | $484,688 |
| 2018 | $4,483 | $594,688 | $110,000 | $484,688 |
| 2017 | $4,248 | $594,688 | $110,000 | $484,688 |
| 2016 | $4,162 | $594,688 | $110,000 | $484,688 |
| 2015 | $4,254 | $609,623 | $120,000 | $489,623 |
| 2014 | -- | $609,623 | $120,000 | $489,623 |
Source: Public Records
Map
Nearby Homes
- 2020 Gardenbrook Dr
- 5300 Deep Valley
- 5317 Deep Valley
- 6508 Deerview Dr
- 7000 Holly Springs Rd
- 2328 Toll Mill Ct
- 106 Birkhaven Dr
- 7029 Spring Ridge Rd
- 2517 High Ridge Dr
- 2321 Toll Mill Ct
- 1900 High Oaks Ln
- 9004 Penny Rd
- 4800 Theys Rd
- 2721 Glassman Ln
- 3120 White Dove Ct
- 5033 Theys Rd
- 5212 Theys Rd
- 8014 Penny Rd
- 8016 Penny Rd
- 1820 Yates Wheel Way
- 3913 Colinwood Ln
- 4801 Fielding Dr
- 2201 Wood Cutter Ct
- 4733 Fielding Dr
- 2812 Swift Willow Cir
- 3912 Colinwood Ln
- 2205 Wood Cutter Ct
- 2808 Swift Willow Cir
- 2809 Swift Willow Cir
- 4729 Fielding Dr
- 2209 Wood Cutter Ct
- 3916 Devan Oaks Way
- 3917 Devan Oaks Way
- 3920 Colinwood Ln
- 2804 Swift Willow Cir
- 2805 Swift Willow Cir
- 3921 Colinwood Ln
- 2213 Wood Cutter Ct
- 4725 Fielding Dr
- 3913 Devan Oaks Way