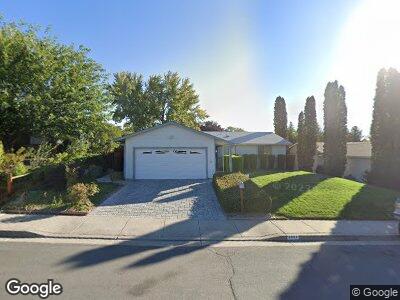
3909 Kings Row Reno, NV 89503
Kings Row NeighborhoodEstimated Value: $477,332 - $517,000
3
Beds
2
Baths
1,320
Sq Ft
$374/Sq Ft
Est. Value
About This Home
This home is located at 3909 Kings Row, Reno, NV 89503 and is currently estimated at $493,083, approximately $373 per square foot. 3909 Kings Row is a home located in Washoe County with nearby schools including Mamie Towles Elementary School, Archie Clayton Pre-AP Academy, and Robert McQueen High School.
Ownership History
Date
Name
Owned For
Owner Type
Purchase Details
Closed on
Nov 25, 2024
Sold by
Laurence And Cecelia Neroda Family Trust and Neroda Cecelia L
Bought by
Laurence James And Cecelia Louise Neroda Fami and Neroda
Current Estimated Value
Purchase Details
Closed on
Jan 23, 1997
Sold by
Neroda Laurence J and Neroda Cecelia L
Bought by
Nerolda Laurence J and Nerolda Celian L
Create a Home Valuation Report for This Property
The Home Valuation Report is an in-depth analysis detailing your home's value as well as a comparison with similar homes in the area
Home Values in the Area
Average Home Value in this Area
Purchase History
| Date | Buyer | Sale Price | Title Company |
|---|---|---|---|
| Laurence James And Cecelia Louise Neroda Fami | -- | None Listed On Document | |
| Nerolda Laurence J | -- | -- |
Source: Public Records
Mortgage History
| Date | Status | Borrower | Loan Amount |
|---|---|---|---|
| Previous Owner | Fa Laurence | $100,000 | |
| Previous Owner | Neroda Laurence J | $100,000 | |
| Previous Owner | Neroda Laurence J | $100,000 | |
| Previous Owner | Neroda Laurence J | $90,000 |
Source: Public Records
Tax History Compared to Growth
Tax History
| Year | Tax Paid | Tax Assessment Tax Assessment Total Assessment is a certain percentage of the fair market value that is determined by local assessors to be the total taxable value of land and additions on the property. | Land | Improvement |
|---|---|---|---|---|
| 2025 | $1,589 | $67,535 | $38,570 | $28,965 |
| 2024 | $1,589 | $64,627 | $34,965 | $29,662 |
| 2023 | $1,544 | $65,720 | $37,170 | $28,550 |
| 2022 | $1,500 | $53,903 | $29,785 | $24,118 |
| 2021 | $1,457 | $45,761 | $21,350 | $24,411 |
| 2020 | $1,413 | $48,519 | $23,730 | $24,789 |
| 2019 | $1,373 | $47,852 | $23,625 | $24,227 |
| 2018 | $1,332 | $39,139 | $15,155 | $23,984 |
| 2017 | $1,293 | $37,940 | $13,090 | $24,850 |
| 2016 | $1,265 | $38,950 | $13,370 | $25,580 |
| 2015 | $936 | $36,374 | $11,375 | $24,999 |
| 2014 | $1,207 | $35,920 | $11,655 | $24,265 |
| 2013 | -- | $31,659 | $7,385 | $24,274 |
Source: Public Records
Map
Nearby Homes
- 3846 Belvedere Dr
- 3545 Balboa Dr
- 3398 Big Sky Dr
- 1340 Rayburn Dr
- 3201 Green River Dr
- 2640 Emily St
- 1350 Marne Dr
- 3452 Bowie Rd Unit 2
- 4985 W 7th St Unit 11
- 4985 W 7th St Unit 14
- 2645 Emily St
- 1420 Exeter Way
- 5284 Tappan Ct
- 1193 Wagon Wheel Cir
- 3920 W 7th St
- 1210 Conway Ln
- 2170 Santona Cir
- 3190 Cartwright Rd
- 1169 Wagon Wheel Cir
- 5540 Twin Creeks Dr
- 3909 Kings Row
- 3905 Kings Row
- 3913 Kings Row
- 3925 Belmore Way
- 3911 Belmore Way
- 3917 Kings Row
- 3931 Belmore Way
- 3901 Kings Row
- 3912 Kings Row
- 3935 Belmore Way
- 3908 Kings Row
- 3921 Kings Row
- 3916 Kings Row
- 3904 Kings Row
- 3920 Kings Row
- 3900 Kings Row
- 3945 Belmore Way
- 3825 Kings Row
- 3920 Belmore Way
- 3965 Kentwood Ct