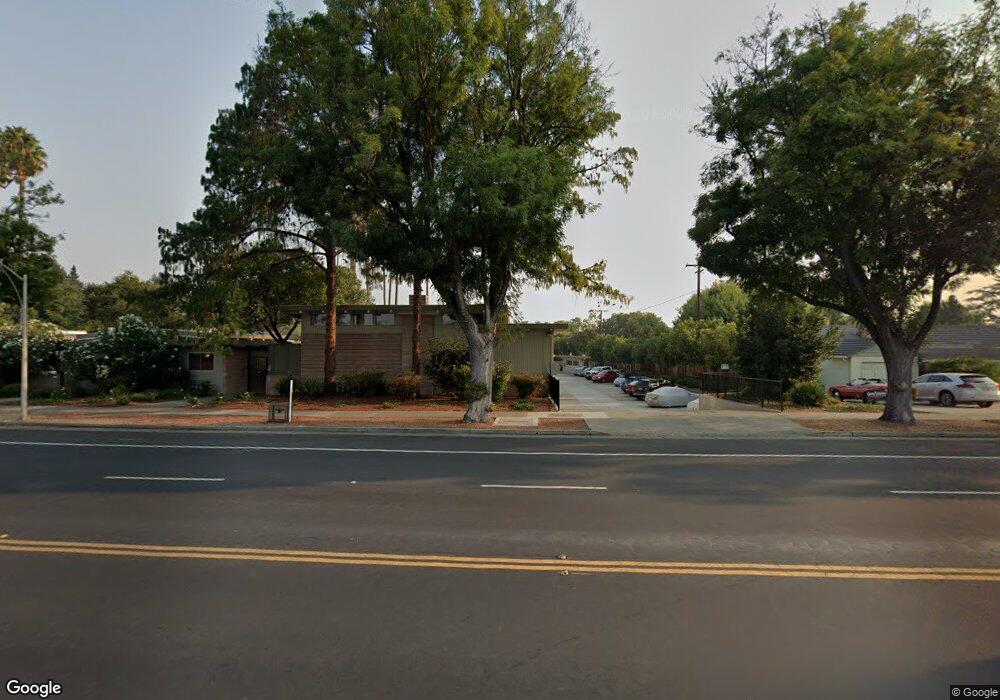
3909 Middlefield Rd Unit D Palo Alto, CA 94303
Charleston Gardens NeighborhoodEstimated Value: $1,121,000 - $1,226,000
2
Beds
2
Baths
1,238
Sq Ft
$957/Sq Ft
Est. Value
About This Home
This home is located at 3909 Middlefield Rd Unit D, Palo Alto, CA 94303 and is currently estimated at $1,185,010, approximately $957 per square foot. 3909 Middlefield Rd Unit D is a home located in Santa Clara County with nearby schools including Fairmeadow Elementary School, Jane Lathrop Stanford Middle School, and Henry M. Gunn High School.
Ownership History
Date
Name
Owned For
Owner Type
Purchase Details
Closed on
Jun 7, 2007
Sold by
Wells Fargo Bank Na
Bought by
Kahn Lauren Margot
Current Estimated Value
Home Financials for this Owner
Home Financials are based on the most recent Mortgage that was taken out on this home.
Original Mortgage
$460,000
Outstanding Balance
$281,014
Interest Rate
6.16%
Mortgage Type
Purchase Money Mortgage
Estimated Equity
$903,996
Purchase Details
Closed on
May 5, 2006
Sold by
Wood Smith Stephanie
Bought by
Wood Smith Stephanie and The Stephanie Wood Smith Livin
Purchase Details
Closed on
Jan 28, 2002
Sold by
Wood Smith Stephanie and The Beverly Wood Ford Trust
Bought by
Wood Smith Stephanie
Purchase Details
Closed on
Jul 11, 1994
Sold by
Ford Beverly Wood
Bought by
Ford Beverly Wood and Wood Smith Stephanie
Create a Home Valuation Report for This Property
The Home Valuation Report is an in-depth analysis detailing your home's value as well as a comparison with similar homes in the area
Home Values in the Area
Average Home Value in this Area
Purchase History
| Date | Buyer | Sale Price | Title Company |
|---|---|---|---|
| Kahn Lauren Margot | -- | Chicago Title Company | |
| Wood Smith Stephanie | -- | None Available | |
| Wood Smith Stephanie | -- | -- | |
| Ford Beverly Wood | -- | -- |
Source: Public Records
Mortgage History
| Date | Status | Borrower | Loan Amount |
|---|---|---|---|
| Open | Kahn Lauren Margot | $460,000 |
Source: Public Records
Tax History Compared to Growth
Tax History
| Year | Tax Paid | Tax Assessment Tax Assessment Total Assessment is a certain percentage of the fair market value that is determined by local assessors to be the total taxable value of land and additions on the property. | Land | Improvement |
|---|---|---|---|---|
| 2025 | $9,762 | $770,364 | $385,182 | $385,182 |
| 2024 | $9,762 | $755,260 | $377,630 | $377,630 |
| 2023 | $9,614 | $740,452 | $370,226 | $370,226 |
| 2022 | $9,496 | $725,934 | $362,967 | $362,967 |
| 2021 | $9,308 | $711,700 | $355,850 | $355,850 |
| 2020 | $9,128 | $704,404 | $352,202 | $352,202 |
| 2019 | $9,021 | $690,594 | $345,297 | $345,297 |
| 2018 | $8,787 | $677,054 | $338,527 | $338,527 |
| 2017 | $8,631 | $663,780 | $331,890 | $331,890 |
| 2016 | $8,399 | $650,766 | $325,383 | $325,383 |
| 2015 | $8,312 | $640,992 | $320,496 | $320,496 |
| 2014 | $8,072 | $628,436 | $314,218 | $314,218 |
Source: Public Records
Map
Nearby Homes
- 731 E Charleston Rd
- 3946 Louis Rd
- 795 E Charleston Rd
- 777 San Antonio Rd Unit 93
- 777 San Antonio Rd Unit 14
- 777 San Antonio Rd Unit 25
- 3941 Duncan Place
- 418 Ferne Ave
- 866 Altaire Walk Unit D68
- 444 San Antonio Rd Unit 1A
- 110 Greenmeadow Way Unit 10
- 3638 Bryant St
- 176 Ferne Ct
- 4225 Park Blvd
- 278 Monroe Dr Unit 35
- 4163 Park Blvd
- 471 Victory Ave
- 26 Roosevelt Cir
- 342 Carolina Ln
- 181 Del Medio Ave Unit 307
- 3909 Middlefield Rd Unit H
- 3909 Middlefield Rd Unit A
- 3909 Middlefield Rd Unit B
- 3909 Middlefield Rd Unit C
- 3909 Middlefield Rd Unit E
- 3909 Middlefield Rd Unit F
- 3909 Middlefield Rd Unit G
- 3969 Middlefield Rd
- 3905 Middlefield Rd Unit D
- 3905 Middlefield Rd Unit C
- 3905 Middlefield Rd Unit B
- 3905 Middlefield Rd Unit A
- 3982 Sutherland Dr
- 3979 Middlefield Rd
- 3976 Sutherland Dr
- 3970 Sutherland Dr
- 3907 Middlefield Rd Unit F
- 3907 Middlefield Rd Unit A
- 3907 Middlefield Rd Unit B
- 3907 Middlefield Rd Unit C