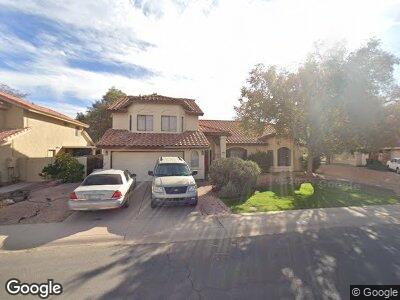
391 N Cholla St Chandler, AZ 85224
Central Ridge NeighborhoodEstimated Value: $658,879 - $793,000
--
Bed
4
Baths
2,897
Sq Ft
$255/Sq Ft
Est. Value
About This Home
This home is located at 391 N Cholla St, Chandler, AZ 85224 and is currently estimated at $739,470, approximately $255 per square foot. 391 N Cholla St is a home located in Maricopa County with nearby schools including San Marcos Elementary School, Andersen Junior High School, and Chandler High School.
Ownership History
Date
Name
Owned For
Owner Type
Purchase Details
Closed on
Jan 7, 2005
Sold by
Mcleod Martin W
Bought by
Mcleod Martin W and Urquhart Mcleod Deborah
Current Estimated Value
Home Financials for this Owner
Home Financials are based on the most recent Mortgage that was taken out on this home.
Original Mortgage
$40,000
Interest Rate
5.8%
Mortgage Type
Credit Line Revolving
Purchase Details
Closed on
Nov 12, 2002
Sold by
Hillman Stephen M and Hillman Lynda Lee
Bought by
Mcleod Martin W
Purchase Details
Closed on
Sep 17, 1998
Sold by
Hillman Lynda L
Bought by
Hillman Stephen M
Home Financials for this Owner
Home Financials are based on the most recent Mortgage that was taken out on this home.
Original Mortgage
$149,300
Interest Rate
6.73%
Purchase Details
Closed on
Jun 10, 1997
Sold by
Date Chetan G and Date Shobhna C
Bought by
Hillman Stephen M
Home Financials for this Owner
Home Financials are based on the most recent Mortgage that was taken out on this home.
Original Mortgage
$148,800
Interest Rate
7.98%
Mortgage Type
New Conventional
Create a Home Valuation Report for This Property
The Home Valuation Report is an in-depth analysis detailing your home's value as well as a comparison with similar homes in the area
Home Values in the Area
Average Home Value in this Area
Purchase History
| Date | Buyer | Sale Price | Title Company |
|---|---|---|---|
| Mcleod Martin W | -- | Fidelity National Title | |
| Mcleod Martin W | $239,500 | American Title Ins Agency Az | |
| Hillman Stephen M | -- | Capital Title Agency | |
| Hillman Stephen M | $186,000 | Chicago Title Insurance Co |
Source: Public Records
Mortgage History
| Date | Status | Borrower | Loan Amount |
|---|---|---|---|
| Open | Mcleod Martin W | $30,000 | |
| Open | Mcleod Martin W | $275,000 | |
| Closed | Mcleod Martin W | $40,000 | |
| Previous Owner | Hillman Stephen M | $149,300 | |
| Previous Owner | Hillman Stephen M | $148,800 |
Source: Public Records
Tax History Compared to Growth
Tax History
| Year | Tax Paid | Tax Assessment Tax Assessment Total Assessment is a certain percentage of the fair market value that is determined by local assessors to be the total taxable value of land and additions on the property. | Land | Improvement |
|---|---|---|---|---|
| 2025 | $3,026 | $39,377 | -- | -- |
| 2024 | $2,963 | $37,502 | -- | -- |
| 2023 | $2,963 | $55,380 | $11,070 | $44,310 |
| 2022 | $2,859 | $40,580 | $8,110 | $32,470 |
| 2021 | $2,996 | $36,410 | $7,280 | $29,130 |
| 2020 | $2,983 | $33,870 | $6,770 | $27,100 |
| 2019 | $2,869 | $32,110 | $6,420 | $25,690 |
| 2018 | $2,778 | $31,320 | $6,260 | $25,060 |
| 2017 | $2,589 | $31,520 | $6,300 | $25,220 |
| 2016 | $2,494 | $33,760 | $6,750 | $27,010 |
| 2015 | $2,417 | $28,520 | $5,700 | $22,820 |
Source: Public Records
Map
Nearby Homes
- 401 N Cholla St
- 333 N Pennington Dr Unit 55
- 333 N Pennington Dr Unit 15
- 333 N Dobson Rd Unit 6
- 2003 W Tyson St
- 1754 W San Tan St
- 1723 W Mercury Way
- 1238 W Carla Vista Dr
- 1731 W Del Rio St
- 700 N Dobson Rd Unit 54
- 741 N Cholla St
- 77 S Dobson Rd Unit 2
- 299 N Comanche Dr
- 790 N Meadows Dr
- 1582 W Chicago St
- 1573 W Chicago St
- 248 S 95th Place Unit 2
- 1825 W Ray Rd Unit 1119
- 1825 W Ray Rd Unit 1070
- 1825 W Ray Rd Unit 1134
- 391 N Cholla St
- 381 N Cholla St
- 411 N Cholla St
- 1749 W Tyson St
- 380 N Cholla St
- 390 N Cholla St
- 421 N Cholla St
- 1777 W Tyson St
- 1748 W Tyson St
- 431 N Cholla St
- 1797 W Tyson St
- 1762 W Tyson St
- 1733 W Carla Vista Dr
- 1776 W Tyson St
- 441 N Cholla St
- 1749 W Carla Vista Dr
- 1786 W Tyson St
- 1763 W Carla Vista Dr
- 1721 W Tyson St
- 1710 W Tyson St