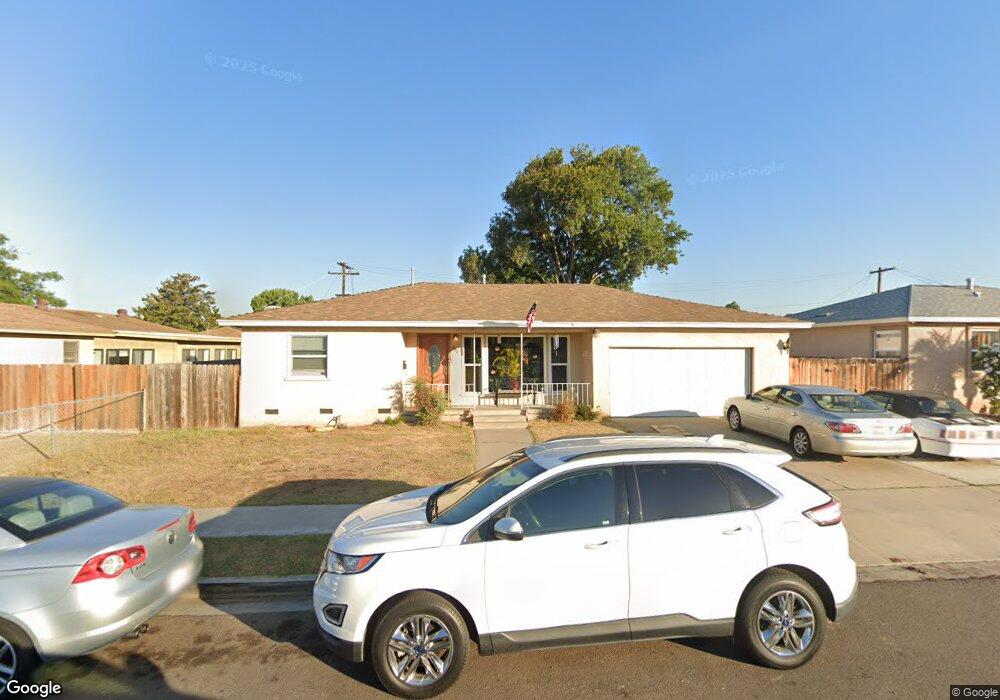
391 Palomar Dr Chula Vista, CA 91911
Downtown Chula Vista NeighborhoodEstimated Value: $733,000 - $856,000
4
Beds
3
Baths
1,866
Sq Ft
$440/Sq Ft
Est. Value
About This Home
This home is located at 391 Palomar Dr, Chula Vista, CA 91911 and is currently estimated at $820,346, approximately $439 per square foot. 391 Palomar Dr is a home located in San Diego County with nearby schools including Lilian J. Rice Elementary School, Chula Vista Middle School, and Chula Vista High School.
Ownership History
Date
Name
Owned For
Owner Type
Purchase Details
Closed on
Apr 22, 2005
Sold by
Amador Humberto Henry
Bought by
Amador Humberto Henry and Amador Ana Maria
Current Estimated Value
Home Financials for this Owner
Home Financials are based on the most recent Mortgage that was taken out on this home.
Original Mortgage
$380,000
Outstanding Balance
$275,085
Interest Rate
5.09%
Mortgage Type
New Conventional
Estimated Equity
$545,261
Purchase Details
Closed on
Feb 24, 2003
Sold by
Kome Patricia L and Cooper Dianne K
Bought by
Amador Humberto Henry
Home Financials for this Owner
Home Financials are based on the most recent Mortgage that was taken out on this home.
Original Mortgage
$320,000
Interest Rate
7.99%
Create a Home Valuation Report for This Property
The Home Valuation Report is an in-depth analysis detailing your home's value as well as a comparison with similar homes in the area
Home Values in the Area
Average Home Value in this Area
Purchase History
| Date | Buyer | Sale Price | Title Company |
|---|---|---|---|
| Amador Humberto Henry | -- | First American Title Co | |
| Amador Humberto Henry | -- | First American Title Co | |
| Amador Humberto Henry | $320,000 | First American Title Co |
Source: Public Records
Mortgage History
| Date | Status | Borrower | Loan Amount |
|---|---|---|---|
| Open | Amador Humberto Henry | $380,000 | |
| Closed | Amador Humberto Henry | $320,000 |
Source: Public Records
Tax History Compared to Growth
Tax History
| Year | Tax Paid | Tax Assessment Tax Assessment Total Assessment is a certain percentage of the fair market value that is determined by local assessors to be the total taxable value of land and additions on the property. | Land | Improvement |
|---|---|---|---|---|
| 2025 | $5,806 | $510,835 | $217,239 | $293,596 |
| 2024 | $5,806 | $500,820 | $212,980 | $287,840 |
| 2023 | $5,726 | $491,001 | $208,804 | $282,197 |
| 2022 | $5,560 | $481,374 | $204,710 | $276,664 |
| 2021 | $5,430 | $471,937 | $200,697 | $271,240 |
| 2020 | $5,299 | $467,099 | $198,640 | $268,459 |
| 2019 | $5,161 | $457,942 | $194,746 | $263,196 |
| 2018 | $5,080 | $448,964 | $190,928 | $258,036 |
| 2017 | $4,972 | $440,162 | $187,185 | $252,977 |
| 2016 | $4,554 | $405,000 | $199,000 | $206,000 |
| 2015 | $4,387 | $390,000 | $192,000 | $198,000 |
| 2014 | $4,057 | $360,000 | $178,000 | $182,000 |
Source: Public Records
Map
Nearby Homes
- 479 Arizona St
- 990 Kittiwake Ln
- 516 L St
- 898 Date Ave
- 345 Moss St Unit 8
- 1029 4th Ave
- 550 L St
- 174 K St
- 1148 3rd Ave Unit 28
- 1148 3rd Ave Unit 58
- 1148 3rd Ave Unit 39
- 658 Cedar Ave
- 657 Sierra Way
- 1148 Third Ave Unit 10
- 786 Madison Ave
- 766 Madison Ave Unit A B
- 580 4th Ave
- 866 Oaklawn Ave
- 776 Oaklawn Ave
- 122 King St