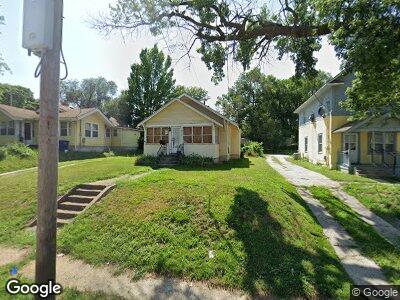
3910 2nd Ave Des Moines, IA 50313
Highland Park NeighborhoodEstimated Value: $110,000 - $166,000
2
Beds
2
Baths
814
Sq Ft
$175/Sq Ft
Est. Value
About This Home
This home is located at 3910 2nd Ave, Des Moines, IA 50313 and is currently estimated at $142,364, approximately $174 per square foot. 3910 2nd Ave is a home located in Polk County with nearby schools including Oak Park Elementary School, Harding Middle School, and North High School.
Ownership History
Date
Name
Owned For
Owner Type
Purchase Details
Closed on
Dec 27, 2006
Sold by
Tomes Deborah S
Bought by
Daniels Joseph
Current Estimated Value
Home Financials for this Owner
Home Financials are based on the most recent Mortgage that was taken out on this home.
Original Mortgage
$86,000
Interest Rate
6.27%
Mortgage Type
Purchase Money Mortgage
Purchase Details
Closed on
Oct 5, 2006
Sold by
Mortgage Electronic Registration Systems
Bought by
Bank One Na
Purchase Details
Closed on
Mar 23, 2006
Sold by
Lane Stella and Lane Charles Thomas
Bought by
Mortgage Electronic Registration Systems
Purchase Details
Closed on
Oct 8, 2001
Sold by
Lane Charles Thomas and Lane Tom
Bought by
Lane Stella
Create a Home Valuation Report for This Property
The Home Valuation Report is an in-depth analysis detailing your home's value as well as a comparison with similar homes in the area
Home Values in the Area
Average Home Value in this Area
Purchase History
| Date | Buyer | Sale Price | Title Company |
|---|---|---|---|
| Daniels Joseph | $85,500 | None Available | |
| Bank One Na | -- | None Available | |
| Mortgage Electronic Registration Systems | $44,000 | None Available | |
| Lane Stella | -- | -- |
Source: Public Records
Mortgage History
| Date | Status | Borrower | Loan Amount |
|---|---|---|---|
| Open | Daniels Joseph | $6,077 | |
| Open | Daniels Joseph | $93,492 | |
| Closed | Daniels Joseph | $86,000 |
Source: Public Records
Tax History Compared to Growth
Tax History
| Year | Tax Paid | Tax Assessment Tax Assessment Total Assessment is a certain percentage of the fair market value that is determined by local assessors to be the total taxable value of land and additions on the property. | Land | Improvement |
|---|---|---|---|---|
| 2024 | $2,222 | $112,900 | $22,600 | $90,300 |
| 2023 | $2,172 | $112,900 | $22,600 | $90,300 |
| 2022 | $2,156 | $92,200 | $19,100 | $73,100 |
| 2021 | $2,036 | $92,200 | $19,100 | $73,100 |
| 2020 | $2,116 | $81,600 | $17,100 | $64,500 |
| 2019 | $2,024 | $81,600 | $17,100 | $64,500 |
| 2018 | $2,004 | $75,300 | $15,500 | $59,800 |
| 2017 | $1,840 | $75,300 | $15,500 | $59,800 |
| 2016 | $1,792 | $68,000 | $14,000 | $54,000 |
| 2015 | $1,792 | $68,000 | $14,000 | $54,000 |
| 2014 | $1,760 | $68,700 | $14,000 | $54,700 |
Source: Public Records
Map
Nearby Homes