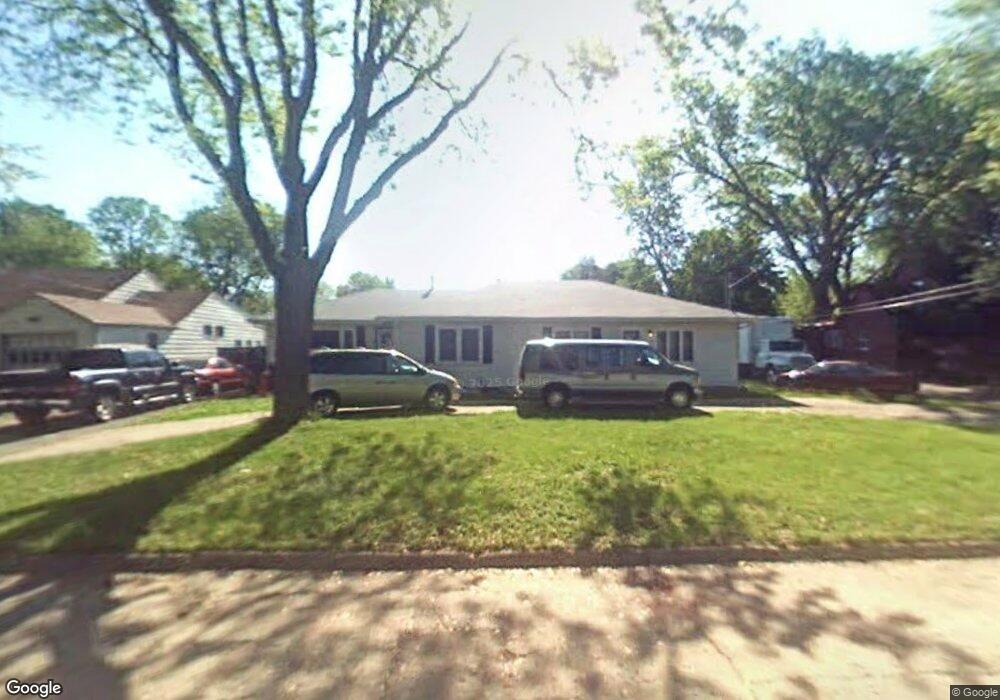
3911 41st St Des Moines, IA 50310
Lower Beaver NeighborhoodEstimated Value: $247,000
5
Beds
4
Baths
1,830
Sq Ft
$135/Sq Ft
Est. Value
About This Home
This home is located at 3911 41st St, Des Moines, IA 50310 and is currently estimated at $247,000, approximately $134 per square foot. 3911 41st St is a home located in Polk County with nearby schools including Samuelson Elementary School, Meredith Middle School, and Hoover High School.
Ownership History
Date
Name
Owned For
Owner Type
Purchase Details
Closed on
Oct 1, 2024
Sold by
Richardson Justin Adam
Bought by
Landrum James Edward
Current Estimated Value
Purchase Details
Closed on
Aug 15, 2024
Sold by
Sellers Betsy
Bought by
Richardson Justin
Purchase Details
Closed on
Oct 20, 2003
Sold by
Sellers Betsy
Bought by
Richards Justin
Home Financials for this Owner
Home Financials are based on the most recent Mortgage that was taken out on this home.
Original Mortgage
$132,000
Interest Rate
8%
Mortgage Type
Land Contract Argmt. Of Sale
Create a Home Valuation Report for This Property
The Home Valuation Report is an in-depth analysis detailing your home's value as well as a comparison with similar homes in the area
Home Values in the Area
Average Home Value in this Area
Purchase History
| Date | Buyer | Sale Price | Title Company |
|---|---|---|---|
| Landrum James Edward | $165,000 | None Listed On Document | |
| Lundrum James Edward | $165,000 | None Listed On Document | |
| Richardson Justin | $140,000 | None Listed On Document | |
| Richards Justin | $140,000 | -- |
Source: Public Records
Mortgage History
| Date | Status | Borrower | Loan Amount |
|---|---|---|---|
| Previous Owner | Richards Justin | $132,000 |
Source: Public Records
Tax History Compared to Growth
Tax History
| Year | Tax Paid | Tax Assessment Tax Assessment Total Assessment is a certain percentage of the fair market value that is determined by local assessors to be the total taxable value of land and additions on the property. | Land | Improvement |
|---|---|---|---|---|
| 2025 | $5,242 | $298,200 | $63,600 | $234,600 |
| 2024 | $5,242 | $266,500 | $56,700 | $209,800 |
| 2023 | $4,986 | $266,500 | $56,700 | $209,800 |
| 2022 | $4,950 | $211,600 | $47,400 | $164,200 |
| 2021 | $5,044 | $211,600 | $47,400 | $164,200 |
| 2020 | $5,240 | $202,100 | $45,100 | $157,000 |
| 2019 | $4,908 | $202,100 | $45,100 | $157,000 |
| 2018 | $4,858 | $182,600 | $39,900 | $142,700 |
| 2017 | $4,354 | $182,600 | $39,900 | $142,700 |
| 2016 | $4,242 | $161,000 | $34,700 | $126,300 |
| 2015 | $4,242 | $161,000 | $34,700 | $126,300 |
| 2014 | $4,268 | $160,600 | $33,900 | $126,700 |
Source: Public Records
Map
Nearby Homes