
Seller's Agent in 2025
Rick Martindale
Allstar Properties
(703) 967-2433
1 in this area
31 Total Sales

Estimated Value: $252,475 - $258,000
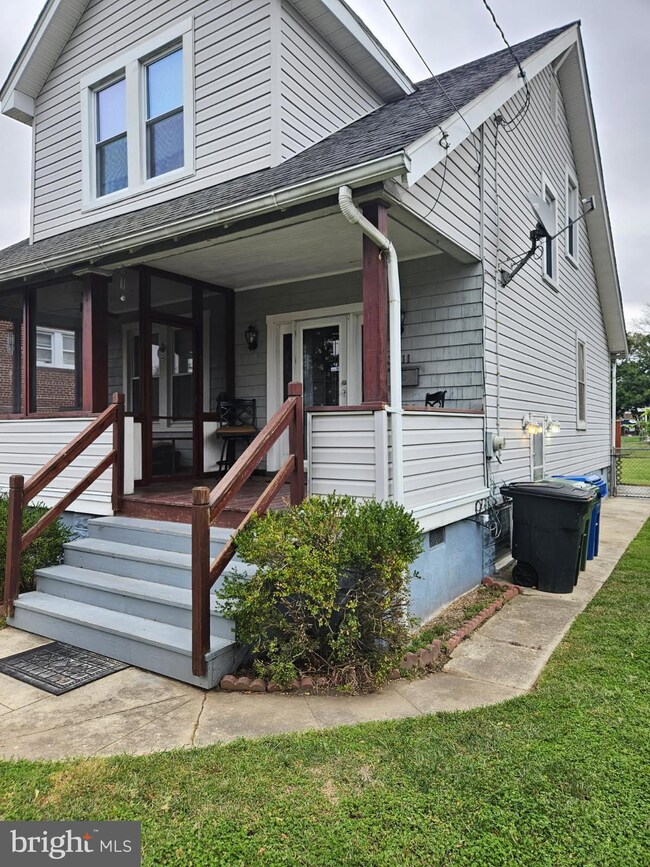
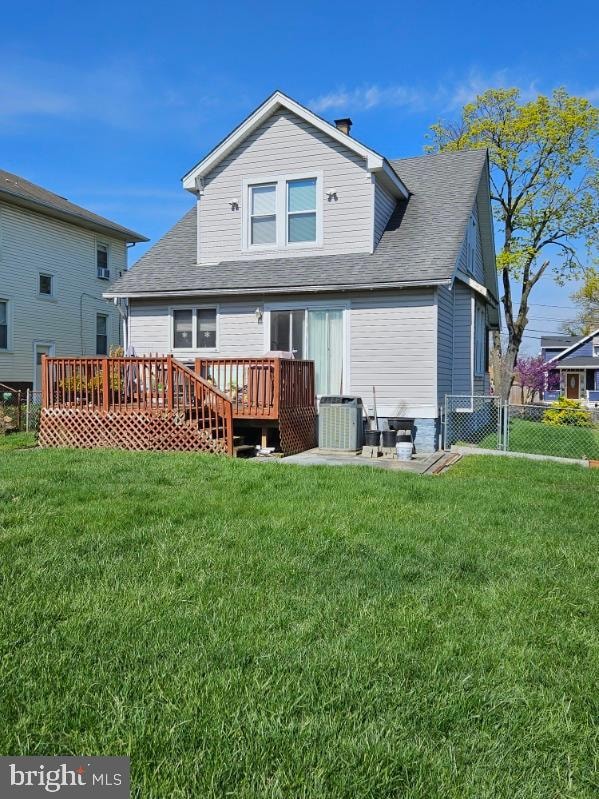
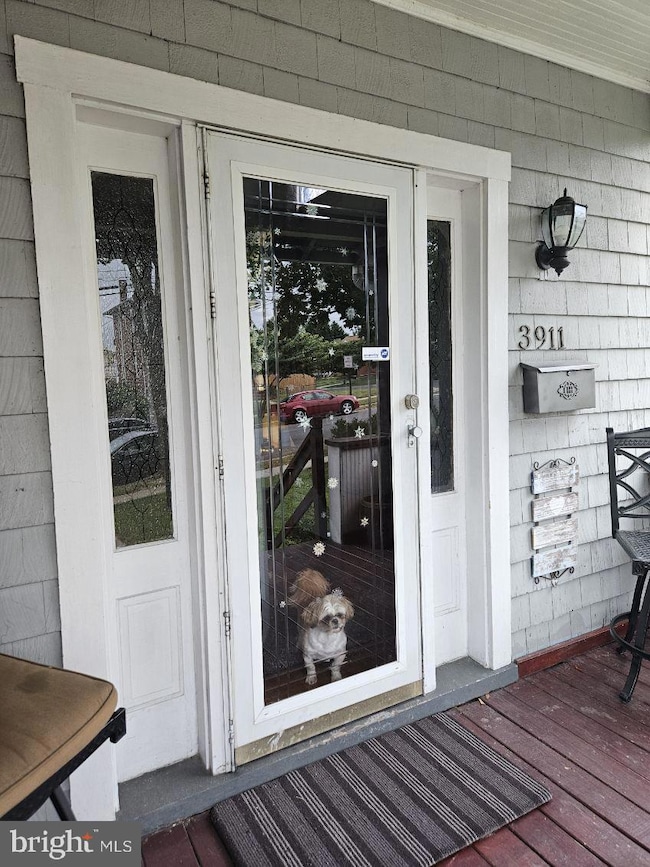
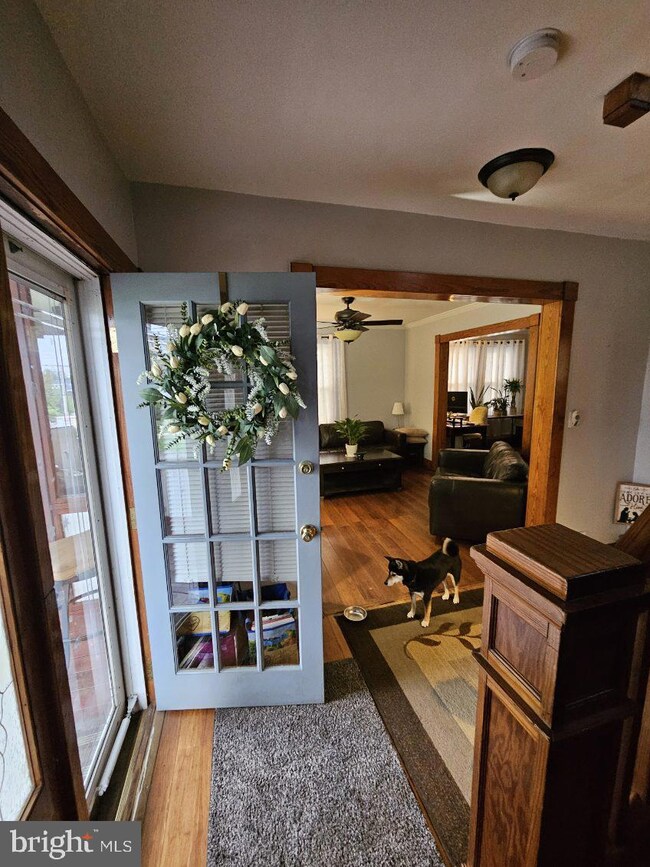
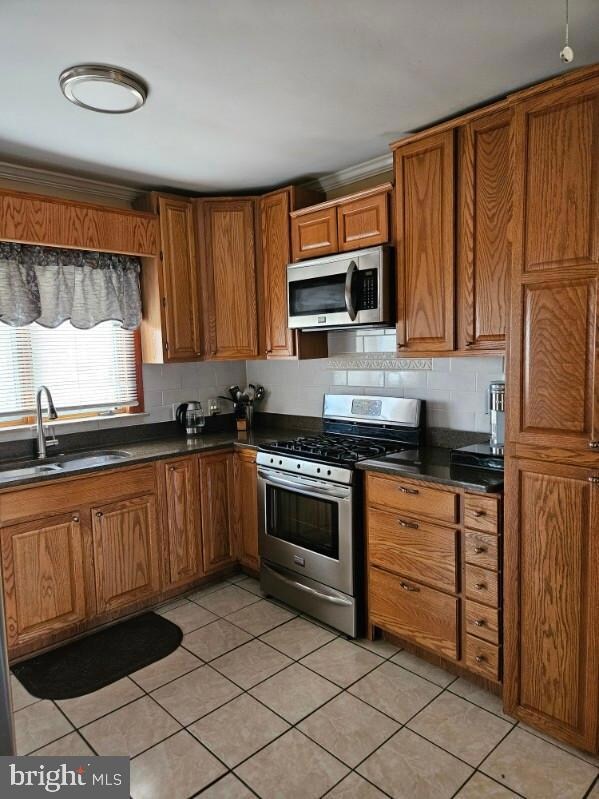
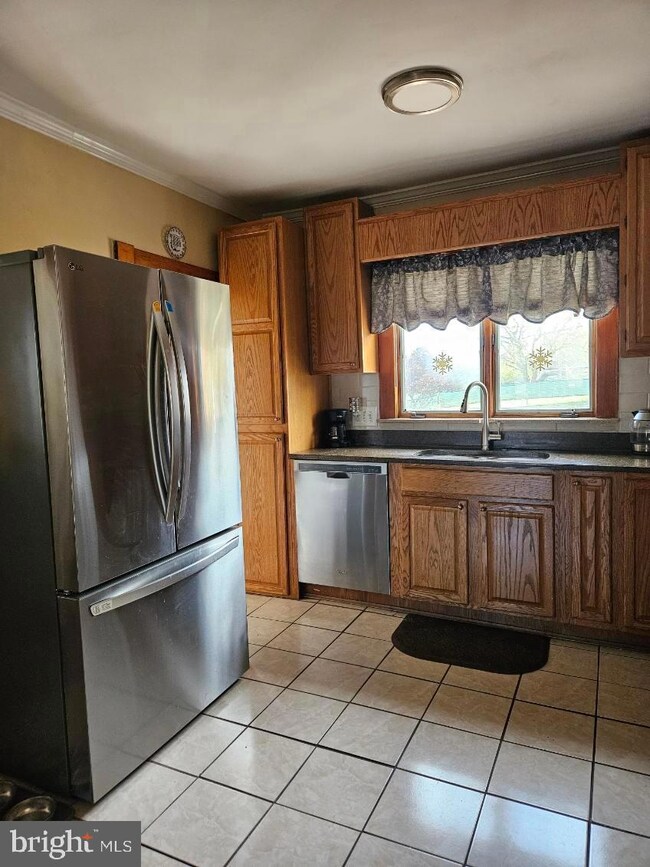
Great opportunity for a move-in-ready, meticulously kept 3-bedroom, 1-bath Cape Cod–style single-family home in Brooklyn! Features gas heat and cooking, beautifully updated interior, and gleaming hardwood floors throughout. Don’t miss this charming, well-maintained home! Sold "As Is"
Last Agent to Sell the Property
(703) 421-6642 rickmartindale@verizon.net Allstar Properties License #0225079836 Listed on: 10/14/2025
Last Buyer's Agent
(410) 255-3690 rshockley@godouglasrealty.com Douglas Realty, LLC License #5009964
| Date | Buyer | Sale Price | Title Company |
|---|---|---|---|
| Herrera Leonard | $249,900 | Admiral Title | |
| Capers Charles E | -- | -- | |
| Capers Charles | $80,250 | -- | |
| Ocwen Federal Bank Fsb | $73,456 | -- |
| Date | Status | Borrower | Loan Amount |
|---|---|---|---|
| Previous Owner | Herrera Leonard | $245,373 |
| Date | Event | Price | List to Sale | Price per Sq Ft |
|---|---|---|---|---|
| 12/03/2025 12/03/25 | Sold | $249,900 | 0.0% | $154 / Sq Ft |
| 10/24/2025 10/24/25 | Pending | -- | -- | -- |
| 10/14/2025 10/14/25 | For Sale | $249,900 | -- | $154 / Sq Ft |
| Year | Tax Paid | Tax Assessment Tax Assessment Total Assessment is a certain percentage of the fair market value that is determined by local assessors to be the total taxable value of land and additions on the property. | Land | Improvement |
|---|---|---|---|---|
| 2025 | $3,368 | $152,000 | -- | -- |
| 2024 | $3,368 | $143,400 | -- | -- |
| 2023 | $3,166 | $134,800 | $44,500 | $90,300 |
| 2022 | $3,101 | $131,400 | $0 | $0 |
| 2021 | $3,021 | $128,000 | $0 | $0 |
| 2020 | $2,714 | $124,600 | $44,500 | $80,100 |
| 2019 | $2,700 | $124,600 | $44,500 | $80,100 |
| 2018 | $2,740 | $124,600 | $44,500 | $80,100 |
| 2017 | $2,909 | $131,300 | $0 | $0 |
| 2016 | $2,777 | $128,867 | $0 | $0 |
| 2015 | $2,777 | $126,433 | $0 | $0 |
| 2014 | $2,777 | $124,000 | $0 | $0 |
Seller's Agent in 2025
Rick Martindale
Allstar Properties
(703) 967-2433
1 in this area
31 Total Sales
Buyer's Agent in 2025
Ronnie Shockley
Douglas Realty, LLC
(443) 373-7871
1 in this area
17 Total Sales
Source: Bright MLS
MLS Number: MDBA2186810
APN: 7110-003
Disclaimer: Certain information contained herein is derived from information provided by parties other than Homes.com. All information provided is deemed reliable, but is not guaranteed to be accurate and should be independently verified.
![]() The data relating to real estate for sale on this website appears in part through the BRIGHT Internet Data Exchange program, a voluntary cooperative exchange of property listing data between licensed real estate brokerage firms, and is provided by BRIGHT through a licensing agreement.
The data relating to real estate for sale on this website appears in part through the BRIGHT Internet Data Exchange program, a voluntary cooperative exchange of property listing data between licensed real estate brokerage firms, and is provided by BRIGHT through a licensing agreement.
Listing information is from various brokers who participate in the Bright MLS IDX program and not all listings may be visible on the site.
The property information being provided on or through the website is for the personal, non-commercial use of consumers and such information may not be used for any purpose other than to identify prospective properties consumers may be interested in purchasing.
Some properties which appear for sale on the website may no longer be available because they are for instance, under contract, sold or are no longer being offered for sale.
Property information displayed is deemed reliable but is not guaranteed.
Copyright 2026 Bright MLS, Inc.
Ask me questions while you tour the home.