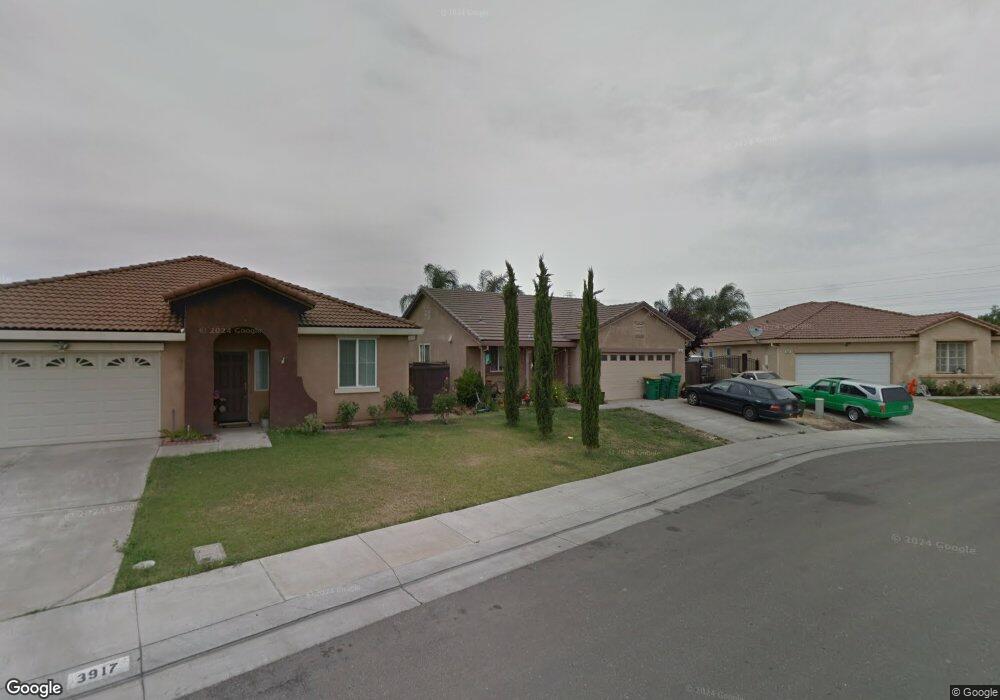
3911 Fletcher Way Stockton, CA 95206
South Stockton NeighborhoodEstimated Value: $343,000 - $405,000
3
Beds
2
Baths
1,146
Sq Ft
$329/Sq Ft
Est. Value
About This Home
This home is located at 3911 Fletcher Way, Stockton, CA 95206 and is currently estimated at $377,571, approximately $329 per square foot. 3911 Fletcher Way is a home located in San Joaquin County with nearby schools including Monroe Elementary School, Alexander Hamilton Elementary, and Van Buren Elementary School.
Ownership History
Date
Name
Owned For
Owner Type
Purchase Details
Closed on
Jun 25, 2009
Sold by
Jpmorgan Chase Bank National Association
Bought by
Alvarez Daniel Tovar
Current Estimated Value
Home Financials for this Owner
Home Financials are based on the most recent Mortgage that was taken out on this home.
Original Mortgage
$96,600
Interest Rate
5.17%
Mortgage Type
Purchase Money Mortgage
Purchase Details
Closed on
Apr 21, 2009
Sold by
Duran Felipe S
Bought by
Jpmorgan Chase Bank National Association
Purchase Details
Closed on
Dec 12, 2003
Sold by
Stockton Little John Creek
Bought by
Duran Felipe S
Home Financials for this Owner
Home Financials are based on the most recent Mortgage that was taken out on this home.
Original Mortgage
$156,225
Interest Rate
5.57%
Mortgage Type
Purchase Money Mortgage
Create a Home Valuation Report for This Property
The Home Valuation Report is an in-depth analysis detailing your home's value as well as a comparison with similar homes in the area
Home Values in the Area
Average Home Value in this Area
Purchase History
| Date | Buyer | Sale Price | Title Company |
|---|---|---|---|
| Alvarez Daniel Tovar | $105,000 | Chicago Title Company | |
| Jpmorgan Chase Bank National Association | $98,000 | Servicelink | |
| Duran Felipe S | $195,500 | Fidelity Natl Title Ins Co |
Source: Public Records
Mortgage History
| Date | Status | Borrower | Loan Amount |
|---|---|---|---|
| Previous Owner | Alvarez Daniel Tovar | $96,600 | |
| Previous Owner | Duran Felipe S | $156,225 |
Source: Public Records
Tax History Compared to Growth
Tax History
| Year | Tax Paid | Tax Assessment Tax Assessment Total Assessment is a certain percentage of the fair market value that is determined by local assessors to be the total taxable value of land and additions on the property. | Land | Improvement |
|---|---|---|---|---|
| 2025 | $1,954 | $135,524 | $33,556 | $101,968 |
| 2024 | $1,902 | $132,868 | $32,899 | $99,969 |
| 2023 | $1,843 | $130,263 | $32,254 | $98,009 |
| 2022 | $1,817 | $127,710 | $31,622 | $96,088 |
| 2021 | $1,741 | $125,206 | $31,002 | $94,204 |
| 2020 | $1,770 | $123,924 | $30,685 | $93,239 |
| 2019 | $1,752 | $121,495 | $30,084 | $91,411 |
| 2018 | $1,715 | $119,114 | $29,495 | $89,619 |
| 2017 | $1,607 | $116,779 | $28,917 | $87,862 |
| 2016 | $1,621 | $114,490 | $28,350 | $86,140 |
| 2014 | $1,550 | $110,562 | $27,377 | $83,185 |
Source: Public Records
Map
Nearby Homes
- 4032 California 99 Unit 3
- 3226 Vermillion Dr
- 2343 Tidewind Dr
- 4326 Highbridge Ln
- 3435 Marfargoa Rd Unit 74
- Plan 2541 at Parkside at Kennedy Ranch
- Plan 2308 Modeled at Parkside at Kennedy Ranch
- Plan 1934 Modeled at Parkside at Kennedy Ranch
- Plan 1718 at Parkside at Kennedy Ranch
- Plan 1481 Modeled at Parkside at Kennedy Ranch
- 2321 Amboy Ave
- 2348 E Loomis Rd
- 2328 E Loomis Rd
- 2288 E Loomis Rd
- 2318 E Loomis Rd
- 2150 Michael Ave
- 3349 Zamora Way
- 3028 Malisa Way
- 2128 Pock Ln
- 1711 Benedino Cir
- 3917 Fletcher Way
- 3905 Fletcher Way
- 3850 Holdrege Way
- 3910 Holdrege Way
- 3925 Fletcher Way
- 3011 Cass Ln
- 3918 Holdrege Way
- 3834 Holdrege Way
- 3929 Fletcher Way
- 3912 Fletcher Way
- 3930 Holdrege Way
- 3023 Cass Ln
- 3920 Fletcher Way
- 2930 Mccook Way
- 2938 Mccook Way
- 2922 Mccook Way
- 3035 Cass Ln
- 3926 Fletcher Way
- 3933 Fletcher Way
- 2944 Mccook Way