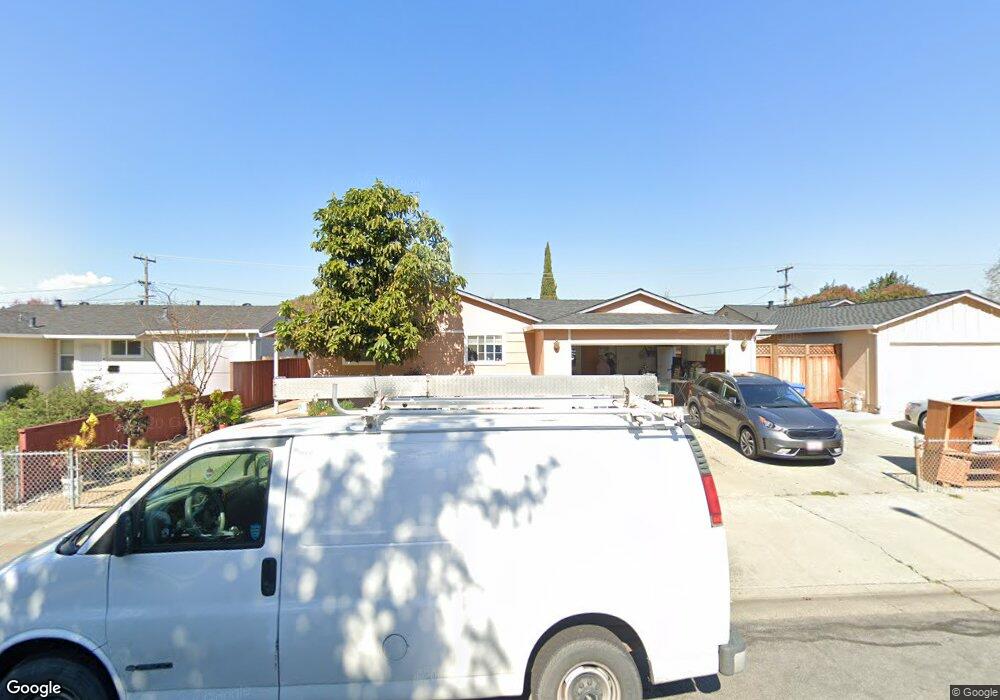
39126 Blacow Rd Fremont, CA 94538
Sundale NeighborhoodEstimated Value: $1,334,556 - $1,568,000
3
Beds
2
Baths
1,344
Sq Ft
$1,067/Sq Ft
Est. Value
About This Home
This home is located at 39126 Blacow Rd, Fremont, CA 94538 and is currently estimated at $1,434,139, approximately $1,067 per square foot. 39126 Blacow Rd is a home located in Alameda County with nearby schools including Joseph Azevada Elementary School, G.M. Walters Middle School, and John F. Kennedy High School.
Ownership History
Date
Name
Owned For
Owner Type
Purchase Details
Closed on
Jan 22, 2023
Sold by
Krishan Rajinder
Bought by
House Of Krishan Revocable Trust
Current Estimated Value
Purchase Details
Closed on
Apr 12, 2010
Sold by
Krishan Rajinder and Rani Bimla
Bought by
Krishan Rajinder and Rani Bimla
Home Financials for this Owner
Home Financials are based on the most recent Mortgage that was taken out on this home.
Original Mortgage
$395,000
Interest Rate
4.95%
Mortgage Type
New Conventional
Purchase Details
Closed on
Sep 22, 2004
Sold by
Kerawala Akhtar H and Kerawala Laila A
Bought by
Krishan Rajinder and Rani Bimla
Home Financials for this Owner
Home Financials are based on the most recent Mortgage that was taken out on this home.
Original Mortgage
$424,000
Interest Rate
5%
Mortgage Type
Purchase Money Mortgage
Create a Home Valuation Report for This Property
The Home Valuation Report is an in-depth analysis detailing your home's value as well as a comparison with similar homes in the area
Home Values in the Area
Average Home Value in this Area
Purchase History
| Date | Buyer | Sale Price | Title Company |
|---|---|---|---|
| House Of Krishan Revocable Trust | -- | -- | |
| Krishan Rajinder | -- | Chicago Title Company | |
| Krishan Rajinder | $530,000 | Commonwealth Land Title |
Source: Public Records
Mortgage History
| Date | Status | Borrower | Loan Amount |
|---|---|---|---|
| Previous Owner | Krishan Rajinder | $395,000 | |
| Previous Owner | Krishan Rajinder | $424,000 | |
| Closed | Krishan Rajinder | $53,000 |
Source: Public Records
Tax History Compared to Growth
Tax History
| Year | Tax Paid | Tax Assessment Tax Assessment Total Assessment is a certain percentage of the fair market value that is determined by local assessors to be the total taxable value of land and additions on the property. | Land | Improvement |
|---|---|---|---|---|
| 2025 | $8,946 | $731,703 | $221,611 | $517,092 |
| 2024 | $8,946 | $717,223 | $217,267 | $506,956 |
| 2023 | $8,702 | $710,024 | $213,007 | $497,017 |
| 2022 | $8,585 | $689,107 | $208,832 | $487,275 |
| 2021 | $8,375 | $675,458 | $204,737 | $477,721 |
| 2020 | $8,384 | $675,463 | $202,639 | $472,824 |
| 2019 | $8,288 | $662,224 | $198,667 | $463,557 |
| 2018 | $8,125 | $649,244 | $194,773 | $454,471 |
| 2017 | $7,922 | $636,518 | $190,955 | $445,563 |
| 2016 | $7,784 | $624,042 | $187,212 | $436,830 |
| 2015 | $7,678 | $614,671 | $184,401 | $430,270 |
| 2014 | $7,383 | $589,000 | $176,700 | $412,300 |
Source: Public Records
Map
Nearby Homes
- 4714 Serra Ave
- 5033 Blacksand Rd
- 4754 Northdale Dr
- 39530 Dorrington Ct
- 5330 Coco Palm Dr
- 4715 Eggers Dr
- 39090 Presidio Way Unit 237
- 38324 Blacow Rd
- 4600 Nelson St
- 5589 Roosevelt Place
- 38976 Primula Terrace
- 4737 Boone Dr
- 5516 Higo Way
- 5513 Higo Way
- 5550 Higo Way
- 5562 Higo Way
- 38533 Amaranto St
- 39850 Sundale Dr
- 38528 Ambrosia St
- 38532 Cedar Blvd
- 39072 Blacow Rd
- 39134 Blacow Rd
- 39127 Donner Way
- 39064 Blacow Rd
- 39142 Blacow Rd
- 39135 Donner Way
- 39073 Donner Way
- 39143 Donner Way
- 39065 Donner Way
- 39056 Blacow Rd
- 39057 Donner Way
- 39151 Donner Way
- 39048 Blacow Rd
- 39158 Blacow Rd
- 39049 Donner Way
- 39159 Donner Way
- 39128 Donner Way
- 39136 Donner Way
- 39074 Donner Way
- 39144 Donner Way