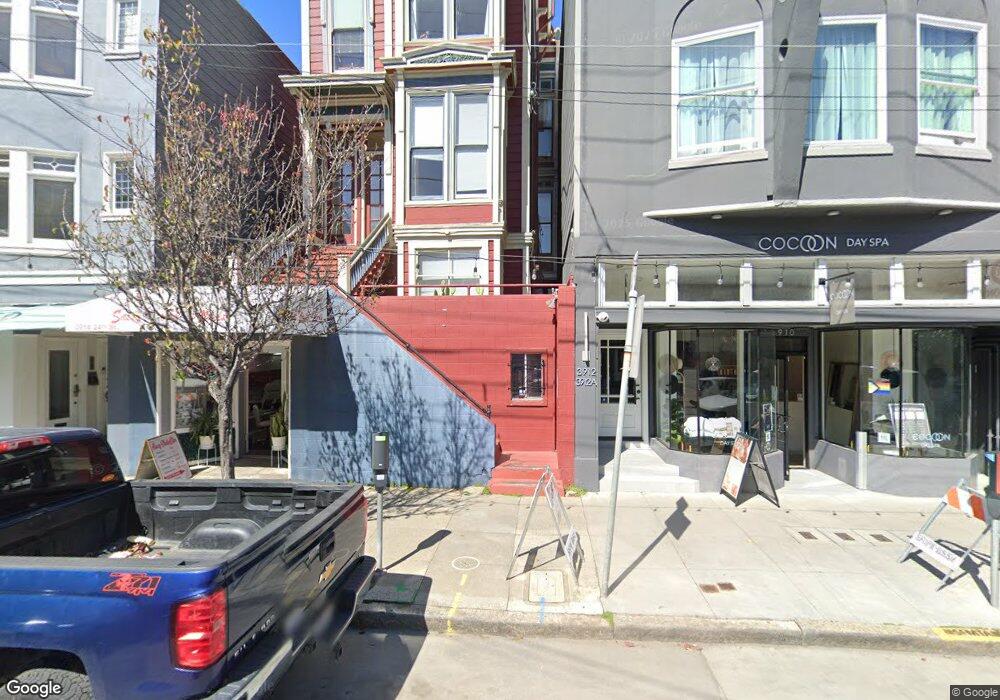
3914 24th St Unit 3916 San Francisco, CA 94114
Noe Valley NeighborhoodEstimated Value: $1,789,000 - $2,886,000
--
Bed
3
Baths
3,057
Sq Ft
$812/Sq Ft
Est. Value
About This Home
This home is located at 3914 24th St Unit 3916, San Francisco, CA 94114 and is currently estimated at $2,482,000, approximately $811 per square foot. 3914 24th St Unit 3916 is a home located in San Francisco County with nearby schools including Alvarado Elementary, James Lick Middle School, and Thomas Edison Charter Academy.
Ownership History
Date
Name
Owned For
Owner Type
Purchase Details
Closed on
Feb 8, 2013
Sold by
Smithton Robert Lee and Keener Susan G
Bought by
Smithton Robert Lee and Keener Susan G
Current Estimated Value
Home Financials for this Owner
Home Financials are based on the most recent Mortgage that was taken out on this home.
Original Mortgage
$515,000
Outstanding Balance
$358,846
Interest Rate
3.34%
Mortgage Type
Commercial
Estimated Equity
$2,123,154
Purchase Details
Closed on
Jul 15, 2003
Sold by
Smithton Robert Lee and Keener Susan G
Bought by
Smithton Robert Lee and Keener Susan G
Home Financials for this Owner
Home Financials are based on the most recent Mortgage that was taken out on this home.
Original Mortgage
$1,000,000
Outstanding Balance
$421,625
Interest Rate
5.15%
Mortgage Type
Commercial
Estimated Equity
$2,060,375
Purchase Details
Closed on
Apr 27, 1990
Sold by
Smithton Zoya Lee
Bought by
Smithton Robert Lee
Create a Home Valuation Report for This Property
The Home Valuation Report is an in-depth analysis detailing your home's value as well as a comparison with similar homes in the area
Home Values in the Area
Average Home Value in this Area
Purchase History
| Date | Buyer | Sale Price | Title Company |
|---|---|---|---|
| Smithton Robert Lee | -- | Old Republic Title Company | |
| Smithton Robert Lee | -- | -- | |
| Smithton Robert Lee | -- | -- |
Source: Public Records
Mortgage History
| Date | Status | Borrower | Loan Amount |
|---|---|---|---|
| Open | Smithton Robert Lee | $515,000 | |
| Open | Smithton Robert Lee | $1,000,000 |
Source: Public Records
Tax History Compared to Growth
Tax History
| Year | Tax Paid | Tax Assessment Tax Assessment Total Assessment is a certain percentage of the fair market value that is determined by local assessors to be the total taxable value of land and additions on the property. | Land | Improvement |
|---|---|---|---|---|
| 2025 | $4,394 | $170,416 | $49,415 | $120,667 |
| 2024 | $4,394 | $167,082 | $48,447 | $118,301 |
| 2023 | $4,203 | $163,815 | $47,498 | $115,983 |
| 2022 | $4,086 | $160,578 | $46,567 | $113,710 |
| 2021 | $3,981 | $157,436 | $45,654 | $111,782 |
| 2020 | $4,460 | $156,098 | $45,186 | $110,912 |
| 2019 | $4,007 | $153,050 | $44,300 | $108,750 |
| 2018 | $3,909 | $150,061 | $43,432 | $106,629 |
| 2017 | $3,582 | $147,132 | $42,581 | $104,551 |
| 2016 | $3,503 | $144,260 | $41,747 | $102,513 |
| 2015 | $3,440 | $142,103 | $41,120 | $100,983 |
| 2014 | $3,363 | $139,332 | $40,315 | $99,017 |
Source: Public Records
Map
Nearby Homes
- 228 Vicksburg St Unit 3
- 1040 Sanchez St
- 3879 23rd St
- 222 Jersey St
- 3821 23rd St
- 1161 Church St
- 1325 Church St
- 3936 26th St
- 1031 Dolores St
- 376 Hill St
- 4040 Cesar Chavez
- 3779-3781 25th St
- 4149 26th St
- 3451 22nd St
- 1294 Guerrero St
- 1117 Guerrero St Unit 3
- 1117 Guerrero St
- 784-788 Dolores St
- 795 Dolores St
- 785 Dolores St
- 3918 24th St Unit 3918
- 3918 24th St
- 3918 24th St Unit 3920
- 3910 24th St Unit 3912
- 3910 24th St
- 3906 24th St Unit C
- 1078 Sanchez St Unit 1080
- 3930 24th St Unit 4
- 3930 24th St Unit 2
- 3930 24th St Unit 18
- 3930 24th St Unit 17
- 3930 24th St Unit 16
- 3930 24th St Unit 15
- 3930 24th St Unit 14
- 3930 24th St Unit 13
- 3930 24th St Unit 12
- 3930 24th St Unit 11
- 3930 24th St Unit 10
- 3930 24th St Unit 9
- 3930 24th St Unit 8