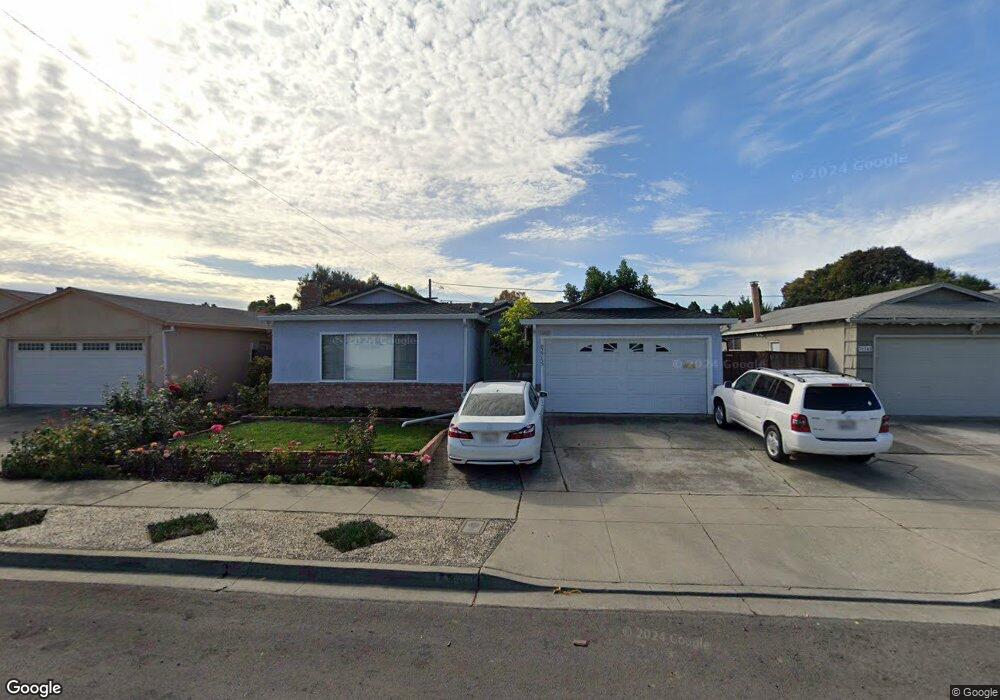
39153 Sonora Ct Fremont, CA 94538
Sundale NeighborhoodEstimated Value: $1,015,000 - $1,475,000
2
Beds
3
Baths
1,498
Sq Ft
$879/Sq Ft
Est. Value
About This Home
This home is located at 39153 Sonora Ct, Fremont, CA 94538 and is currently estimated at $1,316,303, approximately $878 per square foot. 39153 Sonora Ct is a home located in Alameda County with nearby schools including Joseph Azevada Elementary School, G.M. Walters Middle School, and John F. Kennedy High School.
Ownership History
Date
Name
Owned For
Owner Type
Purchase Details
Closed on
Mar 7, 2020
Sold by
Kyaw Joe Myint and Win Jamie Yee
Bought by
Kyaw Joe Myint and Win Jamie Yee
Current Estimated Value
Purchase Details
Closed on
Jan 24, 2002
Sold by
Vincenzi Denise A
Bought by
Kyaw Joe and Win Jamie
Home Financials for this Owner
Home Financials are based on the most recent Mortgage that was taken out on this home.
Original Mortgage
$300,000
Outstanding Balance
$125,010
Interest Rate
7.17%
Estimated Equity
$1,191,293
Purchase Details
Closed on
Apr 13, 1999
Sold by
Vincenzi Denise A and Vincenzi Fred C
Bought by
Vincenzi Denise A
Home Financials for this Owner
Home Financials are based on the most recent Mortgage that was taken out on this home.
Original Mortgage
$172,000
Interest Rate
7.1%
Purchase Details
Closed on
Sep 12, 1997
Sold by
Roberts Fred C
Bought by
Vincenzi Denise A and Vincenzi Roberts Denise A
Create a Home Valuation Report for This Property
The Home Valuation Report is an in-depth analysis detailing your home's value as well as a comparison with similar homes in the area
Home Values in the Area
Average Home Value in this Area
Purchase History
| Date | Buyer | Sale Price | Title Company |
|---|---|---|---|
| Kyaw Joe Myint | -- | None Available | |
| Kyaw Joe | -- | First American Title Guarant | |
| Vincenzi Denise A | -- | Fidelity National Title Ins | |
| Vincenzi Denise A | -- | -- |
Source: Public Records
Mortgage History
| Date | Status | Borrower | Loan Amount |
|---|---|---|---|
| Open | Kyaw Joe | $300,000 | |
| Previous Owner | Vincenzi Denise A | $172,000 | |
| Closed | Kyaw Joe | $42,000 |
Source: Public Records
Tax History Compared to Growth
Tax History
| Year | Tax Paid | Tax Assessment Tax Assessment Total Assessment is a certain percentage of the fair market value that is determined by local assessors to be the total taxable value of land and additions on the property. | Land | Improvement |
|---|---|---|---|---|
| 2025 | $6,976 | $554,335 | $168,400 | $392,935 |
| 2024 | $6,976 | $543,330 | $165,099 | $385,231 |
| 2023 | $6,781 | $539,542 | $161,862 | $377,680 |
| 2022 | $6,681 | $521,963 | $158,689 | $370,274 |
| 2021 | $6,519 | $511,593 | $155,578 | $363,015 |
| 2020 | $6,501 | $513,277 | $153,983 | $359,294 |
| 2019 | $6,428 | $503,214 | $150,964 | $352,250 |
| 2018 | $6,300 | $493,350 | $148,005 | $345,345 |
| 2017 | $6,142 | $483,678 | $145,103 | $338,575 |
| 2016 | $6,031 | $474,197 | $142,259 | $331,938 |
| 2015 | $5,945 | $467,076 | $140,123 | $326,953 |
| 2014 | $5,838 | $457,930 | $137,379 | $320,551 |
Source: Public Records
Map
Nearby Homes
- 4714 Serra Ave
- 5033 Blacksand Rd
- 39530 Dorrington Ct
- 4754 Northdale Dr
- 5330 Coco Palm Dr
- 39090 Presidio Way Unit 237
- 4600 Nelson St
- 4715 Eggers Dr
- 5589 Roosevelt Place
- 4737 Boone Dr
- 38324 Blacow Rd
- 38976 Primula Terrace
- 39850 Sundale Dr
- 5516 Higo Way
- 5550 Higo Way
- 5562 Higo Way
- 38533 Amaranto St
- 4237 Garland Dr
- 38532 Cedar Blvd
- 4328 Cognina Ct
- 39145 Sonora Ct
- 4867 Serra Ave
- 39152 Donner Way
- 39137 Sonora Ct
- 4883 Serra Ave
- 39144 Donner Way
- 39154 Sonora Ct
- 39136 Donner Way
- 39129 Sonora Ct
- 39146 Sonora Ct
- 4843 Serra Ave
- 39138 Sonora Ct
- 4868 Serra Ave
- 4860 Serra Ave
- 4876 Serra Ave
- 39128 Donner Way
- 39075 Sonora Ct
- 4852 Serra Ave
- 39130 Sonora Ct
- 4884 Serra Ave