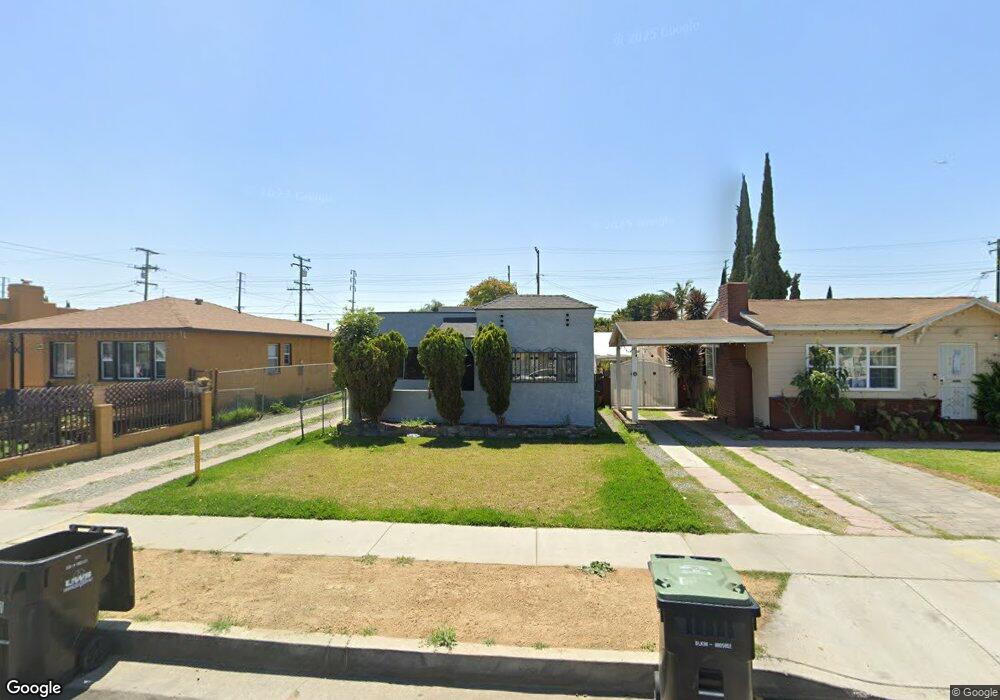
3916 E 56th St Maywood, CA 90270
Estimated Value: $784,000 - $845,000
4
Beds
4
Baths
2,193
Sq Ft
$373/Sq Ft
Est. Value
About This Home
This home is located at 3916 E 56th St, Maywood, CA 90270 and is currently estimated at $818,207, approximately $373 per square foot. 3916 E 56th St is a home located in Los Angeles County with nearby schools including Loma Vista Elementary School, Chester W. Nimitz Middle School, and Maywood Academy High School.
Ownership History
Date
Name
Owned For
Owner Type
Purchase Details
Closed on
Oct 22, 2015
Sold by
Maldonado Leopoldo
Bought by
The Maldonado Family Living Trust
Current Estimated Value
Purchase Details
Closed on
May 10, 2005
Sold by
Maldonado Lucio L
Bought by
Maldonado Leopoldo and Maldonado Rosalva
Purchase Details
Closed on
Mar 26, 2004
Sold by
Maldonado Laura
Bought by
Maldonado Lucio L
Home Financials for this Owner
Home Financials are based on the most recent Mortgage that was taken out on this home.
Original Mortgage
$260,000
Interest Rate
3.97%
Mortgage Type
Purchase Money Mortgage
Purchase Details
Closed on
Mar 2, 2004
Sold by
Chiong Andres and Andres Choing Living Trust
Bought by
Maldonado Lucio
Home Financials for this Owner
Home Financials are based on the most recent Mortgage that was taken out on this home.
Original Mortgage
$260,000
Interest Rate
3.97%
Mortgage Type
Purchase Money Mortgage
Purchase Details
Closed on
Nov 19, 1996
Sold by
Chiong Andres
Bought by
Chiong Andres and Andres Chiong Living Trust
Create a Home Valuation Report for This Property
The Home Valuation Report is an in-depth analysis detailing your home's value as well as a comparison with similar homes in the area
Home Values in the Area
Average Home Value in this Area
Purchase History
| Date | Buyer | Sale Price | Title Company |
|---|---|---|---|
| The Maldonado Family Living Trust | -- | None Available | |
| Maldonado Leopoldo | -- | -- | |
| Maldonado Lucio L | -- | Lawyers | |
| Maldonado Lucio | $325,000 | Land America Lawyers Title | |
| Chiong Andres | -- | -- |
Source: Public Records
Mortgage History
| Date | Status | Borrower | Loan Amount |
|---|---|---|---|
| Previous Owner | Maldonado Lucio | $260,000 |
Source: Public Records
Tax History
| Year | Tax Paid | Tax Assessment Tax Assessment Total Assessment is a certain percentage of the fair market value that is determined by local assessors to be the total taxable value of land and additions on the property. | Land | Improvement |
|---|---|---|---|---|
| 2025 | $6,688 | $462,058 | $119,419 | $342,639 |
| 2024 | $6,688 | $452,999 | $117,078 | $335,921 |
| 2023 | $6,575 | $444,118 | $114,783 | $329,335 |
| 2022 | $6,285 | $435,411 | $112,533 | $322,878 |
| 2021 | $6,203 | $426,875 | $110,327 | $316,548 |
| 2019 | $6,012 | $414,215 | $107,055 | $307,160 |
| 2018 | $5,842 | $406,094 | $104,956 | $301,138 |
| 2016 | $5,473 | $390,328 | $100,882 | $289,446 |
| 2015 | $5,155 | $384,466 | $99,367 | $285,099 |
| 2014 | $5,155 | $376,936 | $97,421 | $279,515 |
Source: Public Records
Map
Nearby Homes
- 3725 E 57th St
- 4101 E 57th St
- 3700 E 55th St
- 3738 E 53rd St
- 5517 Loma Vista Ave
- 5202 Gifford Ave
- 4212 E 58th St
- 5115 Loma Vista Ave
- 4301 E 60th St
- 6072 Gifford Ave
- 5716 Maywood Ave
- 4020 E 61st St
- 3519 E 60th St
- 3602 Randolph Place
- 6048 King Ave
- 4026 Gage Ave
- 5824 Heliotrope Ave
- 6522 Bear Ave
- 3201 3201 Long Beach
- 6600 Fishburn Ave
- 3912 E 56th St
- 3918 E 56th St
- 3908 E 56th St
- 5607 Corona Ave
- 5611 Corona Ave
- 3904 E 56th St
- 5617 Corona Ave
- 3915 E 57th St
- 3921 E 57th St
- 3900 E 56th St
- 3907 E 57th St
- 3921 E 56th St
- 3953 E 57th St
- 3905 E 57th St
- 3925 E 56th St
- 3826 E 56th St
- 3915 E 56th St
- 3959 E 57th St
- 3913 E 56th St
- 4000 E 56th St
Your Personal Tour Guide
Ask me questions while you tour the home.