Estimated Value: $170,676 - $268,000
3
Beds
2
Baths
2,058
Sq Ft
$97/Sq Ft
Est. Value
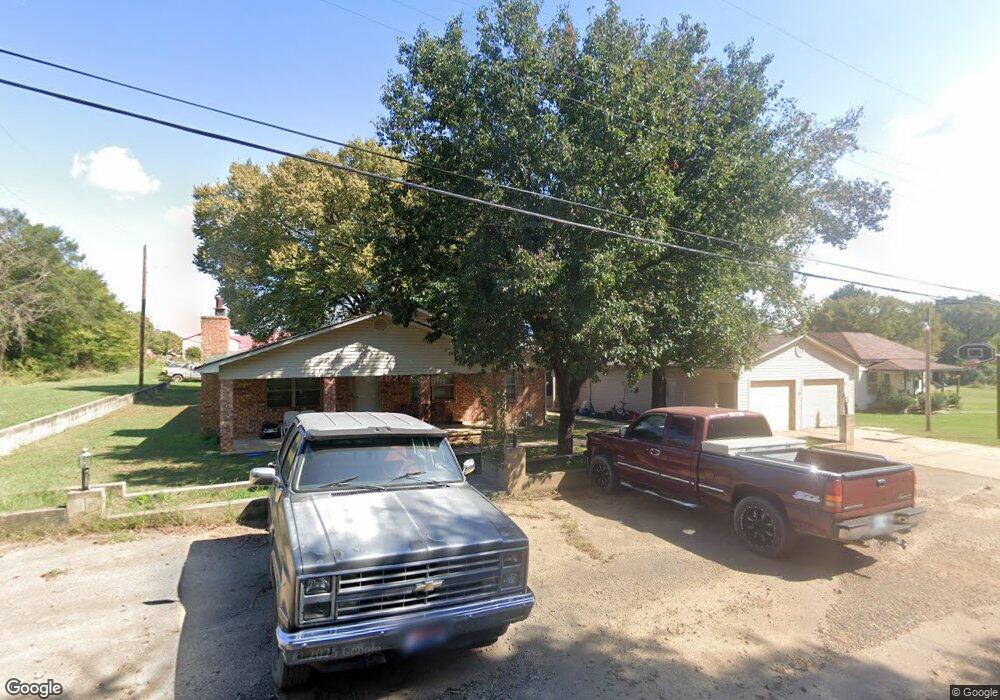
About This Home
This home is located at 39186 Texas Ave, Howe, OK 74940 and is currently estimated at $198,669, approximately $96 per square foot. 39186 Texas Ave is a home located in Le Flore County with nearby schools including Howe Elementary School and Howe High School.
Ownership History
Date
Name
Owned For
Owner Type
Purchase Details
Closed on
Jun 15, 2020
Sold by
Mundy John L and Mundy Nicole
Bought by
Martin Bobby
Current Estimated Value
Home Financials for this Owner
Home Financials are based on the most recent Mortgage that was taken out on this home.
Original Mortgage
$108,007
Outstanding Balance
$95,528
Interest Rate
3.2%
Mortgage Type
FHA
Estimated Equity
$103,141
Purchase Details
Closed on
Sep 1, 2010
Sold by
Mundy Misty D
Bought by
Mundy Johnny L
Home Financials for this Owner
Home Financials are based on the most recent Mortgage that was taken out on this home.
Original Mortgage
$138,855
Interest Rate
4.5%
Mortgage Type
FHA
Purchase Details
Closed on
Jul 18, 2006
Sold by
Ford David E and Ford Ella Colleen
Bought by
Mundy John L and Mundy Misty D
Home Financials for this Owner
Home Financials are based on the most recent Mortgage that was taken out on this home.
Original Mortgage
$135,000
Interest Rate
6.6%
Mortgage Type
New Conventional
Create a Home Valuation Report for This Property
The Home Valuation Report is an in-depth analysis detailing your home's value as well as a comparison with similar homes in the area
Purchase History
| Date | Buyer | Sale Price | Title Company |
|---|---|---|---|
| Martin Bobby | $110,000 | Old Republic Natl Ttl Ins Co | |
| Mundy Johnny L | -- | -- | |
| Mundy John L | $135,000 | -- |
Source: Public Records
Mortgage History
| Date | Status | Borrower | Loan Amount |
|---|---|---|---|
| Open | Martin Bobby | $108,007 | |
| Previous Owner | Mundy Johnny L | $138,855 | |
| Previous Owner | Mundy John L | $135,000 |
Source: Public Records
Tax History
| Year | Tax Paid | Tax Assessment Tax Assessment Total Assessment is a certain percentage of the fair market value that is determined by local assessors to be the total taxable value of land and additions on the property. | Land | Improvement |
|---|---|---|---|---|
| 2025 | $1,204 | $13,933 | $683 | $13,250 |
| 2023 | $1,147 | $12,637 | $385 | $12,252 |
| 2022 | $1,051 | $12,036 | $385 | $11,651 |
| 2021 | $1,011 | $11,619 | $385 | $11,234 |
| 2020 | $821 | $10,389 | $385 | $10,004 |
| 2019 | $810 | $10,236 | $385 | $9,851 |
| 2018 | $787 | $9,938 | $385 | $9,553 |
| 2017 | $762 | $9,649 | $385 | $9,264 |
| 2016 | $787 | $9,831 | $385 | $9,446 |
| 2015 | $868 | $10,750 | $385 | $10,365 |
| 2014 | $899 | $10,943 | $385 | $10,558 |
Source: Public Records
Map
Nearby Homes
- 39689 Texas Ave
- 21406 6th St
- 39777 Choctaw Ave
- 21887 Ranch Rd
- 21415 6th St
- 21686 Cedar Hill Dr
- 39803 Cedar Hills Cir
- 21894 Cedar Hills Dr
- 39929 W Drury Ln
- 21409 9th St
- 130 Nobles Rd
- 39897 Drury Ln
- TBD Scenic View Dr
- TBD Smokey Ln
- 40501 210th Ave
- 23090 J O B Rd
- TBD Us Highway 270
- 39827 Morris Creek Rd
- 22853 Us Highway 270
- TBD Old Pike Rd
- 21478 E Forest Ave
- 39221 Texas Ave
- 21548 W Forest Ave
- 21548 Forrest St
- 21550 W Maple Ave
- 21493 E Forest Ave
- 39254 Texas Ave
- 39239 Spruce St
- 39119 Spruce St
- 21590 W Maple Ave
- 21576 W Forest Ave
- 39267 Spruce St
- 21558 W North Railroad St
- 304 Cherry St
- 2167 Forest Ave
- 39230 Cherry St
- 21608 W Cherry St
- 21590 W North Railroad
- 39277 Cherry St
- 21640 W North Railroad
Your Personal Tour Guide
Ask me questions while you tour the home.