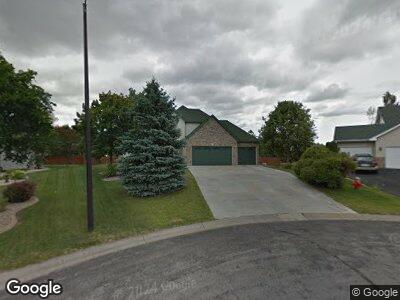
3919 Foxglove Ct N Brooklyn Park, MN 55443
Pinebrook Village NeighborhoodEstimated Value: $498,000 - $522,000
5
Beds
4
Baths
3,401
Sq Ft
$149/Sq Ft
Est. Value
About This Home
This home is located at 3919 Foxglove Ct N, Brooklyn Park, MN 55443 and is currently estimated at $507,070, approximately $149 per square foot. 3919 Foxglove Ct N is a home located in Hennepin County with nearby schools including Woodland Elementary School, Park Center Senior High, and Athlos Leadership Academy.
Ownership History
Date
Name
Owned For
Owner Type
Purchase Details
Closed on
Jan 28, 2021
Sold by
Thibodaux Stacey Fournier and Thibodaux Asa
Bought by
Yang Chee Nou and Vang Ger
Current Estimated Value
Home Financials for this Owner
Home Financials are based on the most recent Mortgage that was taken out on this home.
Original Mortgage
$389,651
Outstanding Balance
$352,178
Interest Rate
2.65%
Mortgage Type
FHA
Estimated Equity
$154,892
Purchase Details
Closed on
Oct 26, 2011
Sold by
Schwagel Donald and Schwagel Joann M
Bought by
Thibodaux Stacey Fournier and Thibodaux Asa
Home Financials for this Owner
Home Financials are based on the most recent Mortgage that was taken out on this home.
Original Mortgage
$302,043
Interest Rate
3.75%
Mortgage Type
FHA
Purchase Details
Closed on
Oct 20, 1998
Sold by
Astra Genstar Partnership Llp
Bought by
Schwagel Donald and Schwagel Joann M
Create a Home Valuation Report for This Property
The Home Valuation Report is an in-depth analysis detailing your home's value as well as a comparison with similar homes in the area
Home Values in the Area
Average Home Value in this Area
Purchase History
| Date | Buyer | Sale Price | Title Company |
|---|---|---|---|
| Yang Chee Nou | $415,000 | Results Title | |
| Thibodaux Stacey Fournier | $309,900 | Realstar Title | |
| Schwagel Donald | $39,900 | -- |
Source: Public Records
Mortgage History
| Date | Status | Borrower | Loan Amount |
|---|---|---|---|
| Open | Yang Chee Nou | $389,651 | |
| Previous Owner | Oumier Stacey F | $319,600 | |
| Previous Owner | Thibodaux Stacey Fournier | $302,043 |
Source: Public Records
Tax History Compared to Growth
Tax History
| Year | Tax Paid | Tax Assessment Tax Assessment Total Assessment is a certain percentage of the fair market value that is determined by local assessors to be the total taxable value of land and additions on the property. | Land | Improvement |
|---|---|---|---|---|
| 2023 | $6,354 | $459,600 | $133,500 | $326,100 |
| 2022 | $5,227 | $470,100 | $133,500 | $336,600 |
| 2021 | $5,170 | $374,900 | $78,000 | $296,900 |
| 2020 | $4,996 | $372,100 | $78,000 | $294,100 |
| 2019 | $5,963 | $342,400 | $78,000 | $264,400 |
| 2018 | $5,197 | $341,300 | $70,300 | $271,000 |
| 2017 | $5,220 | $313,100 | $70,300 | $242,800 |
| 2016 | $4,983 | $292,900 | $70,300 | $222,600 |
| 2015 | $4,818 | $287,800 | $60,600 | $227,200 |
| 2014 | -- | $274,600 | $60,600 | $214,000 |
Source: Public Records
Map
Nearby Homes
- 3725 Impatiens Ln N
- 9713 Evergreen Ave N
- 9282 Dunbar Knoll Cir N
- 9225 Ashley Terrace
- 9243 Yorkshire Ln
- 9149 Farnsworth Ave N
- 3214 98th Cir N
- 9701 Almond Ave N
- 9309 Loch Lomond Ln
- 9128 Cambridge Ave
- 9209 Yorkshire Ln
- 4508 Marigold Ave N
- 4922 93rd Way N
- 3633 91st Crescent N
- 8950 Glen Edin Ln
- 9765 Vincent Ave N
- 10009 Butternut Ave N
- 9325 Sheridan Ave N
- 9030 Windsor Terrace
- 8949 Cambridge Ct
- 3919 Foxglove Ct N
- 3925 Foxglove Ct N
- 3913 Foxglove Ct N
- 9439 Fallgold Pkwy N
- 9451 Fallgold Pkwy N
- 9433 Fallgold Pkwy N
- 3907 Foxglove Ct N
- 3931 Foxglove Ct N
- 4143 Foxglove Ave N
- 9457 Fallgold Pkwy N
- 4137 Foxglove Ave N
- 4149 Foxglove Ave N
- 3937 Foxglove Ct N
- 4131 Foxglove Ave N
- 3901 Foxglove Ct N
- 9463 Fallgold Pkwy N
- 4155 Foxglove Ave N
- 4125 Foxglove Ave N
- 9438 Fallgold Pkwy N
- 9444 Fallgold Pkwy N