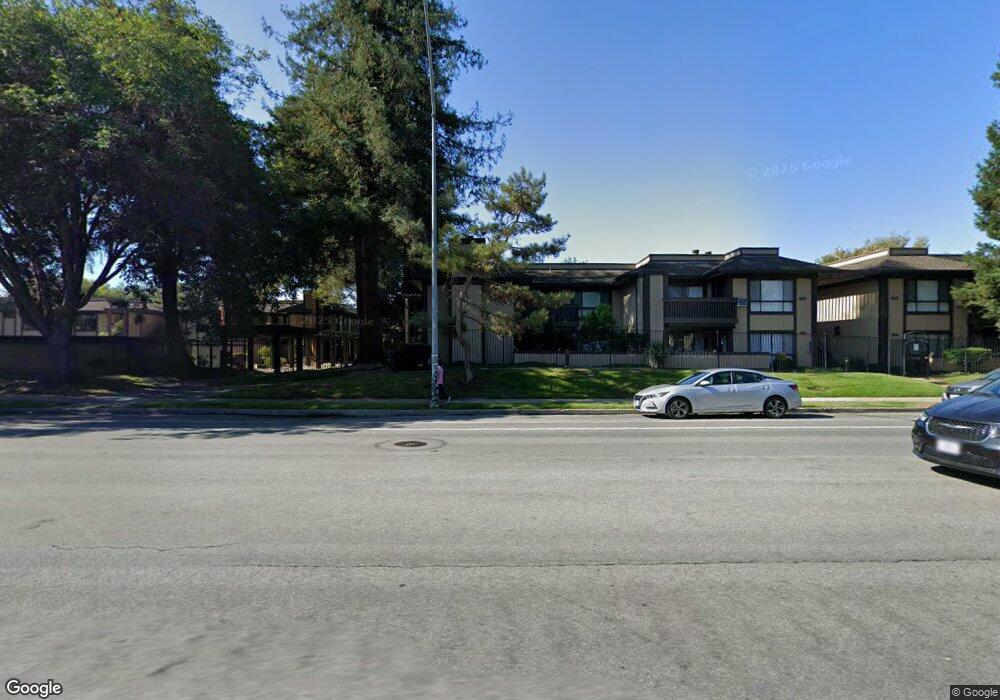
39191 Argonaut Way Unit 113 Fremont, CA 94538
Sundale NeighborhoodEstimated Value: $538,794 - $653,000
1
Bed
1
Bath
1,030
Sq Ft
$568/Sq Ft
Est. Value
About This Home
This home is located at 39191 Argonaut Way Unit 113, Fremont, CA 94538 and is currently estimated at $584,949, approximately $567 per square foot. 39191 Argonaut Way Unit 113 is a home located in Alameda County with nearby schools including Brier Elementary School, G.M. Walters Middle School, and John F. Kennedy High School.
Ownership History
Date
Name
Owned For
Owner Type
Purchase Details
Closed on
Dec 18, 2012
Sold by
Sargiotto Sean and Sargiotto Alicia
Bought by
Galis Victor and Galis Ioana
Current Estimated Value
Purchase Details
Closed on
Jun 18, 2007
Sold by
Wenzel Douglas S and Wenzel Alma Rosa L
Bought by
Wood Alicia and Sargiotto Sean
Home Financials for this Owner
Home Financials are based on the most recent Mortgage that was taken out on this home.
Original Mortgage
$69,950
Interest Rate
6.21%
Mortgage Type
Credit Line Revolving
Purchase Details
Closed on
Jan 5, 2004
Sold by
Tubbs Noreen
Bought by
Wenzel Douglas S and Wenzel Alma Rosa L
Home Financials for this Owner
Home Financials are based on the most recent Mortgage that was taken out on this home.
Original Mortgage
$207,200
Interest Rate
4.4%
Mortgage Type
Purchase Money Mortgage
Create a Home Valuation Report for This Property
The Home Valuation Report is an in-depth analysis detailing your home's value as well as a comparison with similar homes in the area
Home Values in the Area
Average Home Value in this Area
Purchase History
| Date | Buyer | Sale Price | Title Company |
|---|---|---|---|
| Galis Victor | -- | First American Title Company | |
| Wood Alicia | $350,000 | Ticor Title Company Of Ca | |
| Wenzel Douglas S | $259,000 | Alliance Title Company |
Source: Public Records
Mortgage History
| Date | Status | Borrower | Loan Amount |
|---|---|---|---|
| Previous Owner | Wood Alicia | $69,950 | |
| Previous Owner | Wenzel Douglas S | $207,200 |
Source: Public Records
Tax History Compared to Growth
Tax History
| Year | Tax Paid | Tax Assessment Tax Assessment Total Assessment is a certain percentage of the fair market value that is determined by local assessors to be the total taxable value of land and additions on the property. | Land | Improvement |
|---|---|---|---|---|
| 2025 | $3,535 | $253,663 | $76,099 | $177,564 |
| 2024 | $3,535 | $248,691 | $74,607 | $174,084 |
| 2023 | $3,427 | $243,814 | $73,144 | $170,670 |
| 2022 | $3,364 | $239,035 | $71,710 | $167,325 |
| 2021 | $3,293 | $234,348 | $70,304 | $164,044 |
| 2020 | $3,230 | $231,947 | $69,584 | $162,363 |
| 2019 | $3,196 | $227,400 | $68,220 | $159,180 |
| 2018 | $3,132 | $222,943 | $66,883 | $156,060 |
| 2017 | $3,055 | $218,571 | $65,571 | $153,000 |
| 2016 | $2,992 | $214,287 | $64,286 | $150,001 |
| 2015 | $2,941 | $211,068 | $63,320 | $147,748 |
| 2014 | $2,890 | $206,934 | $62,080 | $144,854 |
Source: Public Records
Map
Nearby Homes
- 39090 Presidio Way Unit 237
- 39530 Dorrington Ct
- 38837 Fremont Blvd
- 39134 Memorial St
- 4714 Serra Ave
- 39193 State St
- 4715 Mildred Dr
- 4328 Cognina Ct
- 39751 Bissy Common
- 4600 Nelson St
- 39753 Placer Way
- 4692 Nelson St
- 3275 Capitol Ave
- 38611 Country Common
- 3455 Gilman Common
- 38265 Corrigan Ct
- 3583 Madison Common
- 3454 Dayton Common
- 4715 Eggers Dr
- 4737 Boone Dr
- 39191 Argonaut Way Unit 117
- 39191 Argonaut Way Unit 115
- 39191 Argonaut Way Unit 218
- 39191 Argonaut Way Unit 214
- 39191 Argonaut Way Unit 216
- 39191 Argonaut Way Unit 114
- 39191 Argonaut Way Unit 118
- 39191 Argonaut Way Unit 4
- 39191 Argonaut Way Unit 3
- 39191 Argonaut Way Unit 7
- 39191 Argonaut Way Unit 12
- 39191 Argonaut Way Unit 9
- 39191 Argonaut Way Unit 8
- 39191 Argonaut Way Unit 5
- 39191 Argonaut Way Unit 1
- 39191 Argonaut Way
- 39191 Argonaut Way
- 39191 Argonaut Way Unit 10
- 4303 Sacramento Ave Unit 130
- 4303 Sacramento Ave Unit 127