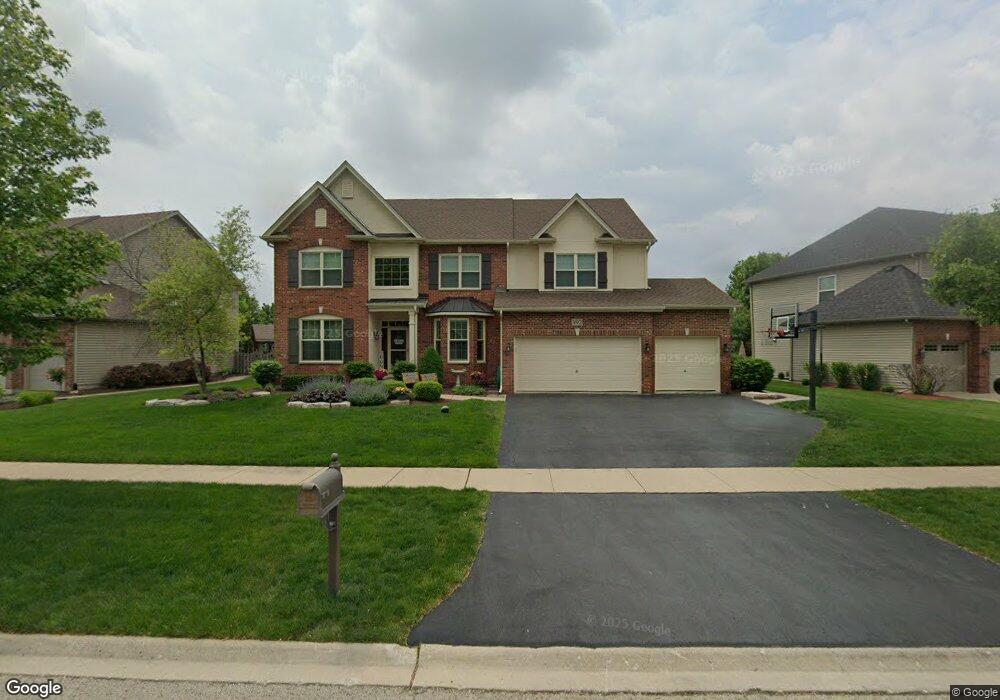
392 Bloomfield Cir E Oswego, IL 60543
South Oswego NeighborhoodEstimated Value: $590,503 - $649,000
4
Beds
3
Baths
3,127
Sq Ft
$202/Sq Ft
Est. Value
About This Home
This home is located at 392 Bloomfield Cir E, Oswego, IL 60543 and is currently estimated at $631,376, approximately $201 per square foot. 392 Bloomfield Cir E is a home located in Kendall County with nearby schools including Southbury Elementary School, Traughber Junior High School, and Oswego High School.
Ownership History
Date
Name
Owned For
Owner Type
Purchase Details
Closed on
Nov 9, 2009
Sold by
Faganel Construction Management Banbury
Bought by
Monti Jon D and Monti Michelle L
Current Estimated Value
Home Financials for this Owner
Home Financials are based on the most recent Mortgage that was taken out on this home.
Original Mortgage
$318,750
Outstanding Balance
$209,299
Interest Rate
5.11%
Mortgage Type
New Conventional
Estimated Equity
$422,077
Create a Home Valuation Report for This Property
The Home Valuation Report is an in-depth analysis detailing your home's value as well as a comparison with similar homes in the area
Home Values in the Area
Average Home Value in this Area
Purchase History
| Date | Buyer | Sale Price | Title Company |
|---|---|---|---|
| Monti Jon D | $375,000 | Chicago Title Insurance Co |
Source: Public Records
Mortgage History
| Date | Status | Borrower | Loan Amount |
|---|---|---|---|
| Open | Monti Jon D | $318,750 |
Source: Public Records
Tax History
| Year | Tax Paid | Tax Assessment Tax Assessment Total Assessment is a certain percentage of the fair market value that is determined by local assessors to be the total taxable value of land and additions on the property. | Land | Improvement |
|---|---|---|---|---|
| 2024 | $14,136 | $181,657 | $30,192 | $151,465 |
| 2023 | $13,270 | $163,655 | $27,200 | $136,455 |
| 2022 | $13,270 | $152,949 | $25,421 | $127,528 |
| 2021 | $12,813 | $142,943 | $23,758 | $119,185 |
| 2020 | $12,175 | $134,852 | $22,413 | $112,439 |
| 2019 | $11,952 | $130,517 | $22,413 | $108,104 |
| 2018 | $11,954 | $125,328 | $21,522 | $103,806 |
| 2017 | $11,981 | $122,871 | $21,100 | $101,771 |
| 2016 | $11,979 | $121,174 | $27,095 | $94,079 |
| 2015 | $11,585 | $112,198 | $25,088 | $87,110 |
| 2014 | -- | $112,198 | $25,088 | $87,110 |
| 2013 | -- | $112,198 | $25,088 | $87,110 |
Source: Public Records
Map
Nearby Homes
- 200 Redding Ct
- 748 Juniper St
- 739 Juniper St
- 94 Templeton Dr
- 1444 Vintage Dr
- 102 Piper Glen Ave
- 202 Piper Glen Ave
- 228 Piper Glen Ave
- 226 Piper Glen Ave
- 204 Dorset Ave
- 739 Alberta Ave
- 230 Piper Glen Ave
- 747 Fairfield Dr
- 731 Fairfield Dr
- 382 Hemlock Ln
- 315 Monica Ln
- 313 Monica Ln
- 2268 Barbera Rd
- 2249 Riesling Rd
- 612 Murdock Place
- 394 Bloomfield Cir E
- 390 Bloomfield Cir E
- 105 Allington Ct
- 396 Bloomfield Cir E
- 388 Bloomfield Cir E
- 391 Bloomfield Cir E
- 103 Allington Ct
- 107 Allington Ct
- 395 Bloomfield Cir E
- 393 Bloomfield Cir E
- 389 Bloomfield Cir E
- 386 Bloomfield Cir E
- 387 Bloomfield Cir E
- 385 Bloomfield Cir E
- 101 Allington Ct
- 397 Bloomfield Cir E
- 108 Allington Ct
- 384 E Bloomfield Lot#116 Cir
- 384 Bloomfield Cir E
- 596 Colchester Dr
Your Personal Tour Guide
Ask me questions while you tour the home.