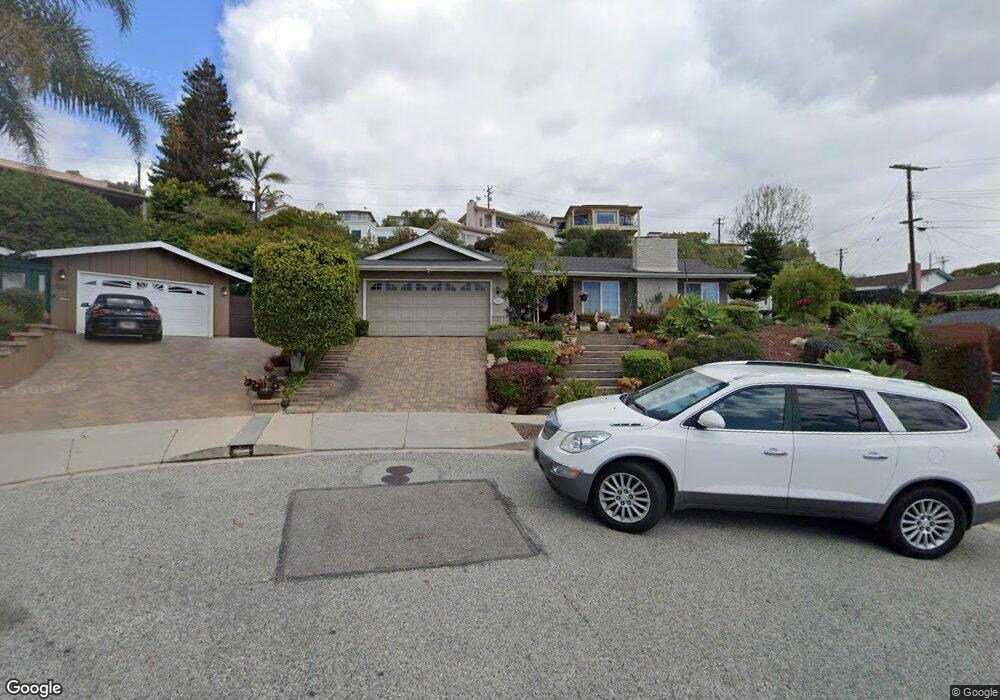
392 Teloma Dr Ventura, CA 93003
College NeighborhoodEstimated Value: $1,023,366 - $1,168,000
4
Beds
2
Baths
1,906
Sq Ft
$580/Sq Ft
Est. Value
About This Home
This home is located at 392 Teloma Dr, Ventura, CA 93003 and is currently estimated at $1,105,592, approximately $580 per square foot. 392 Teloma Dr is a home located in Ventura County with nearby schools including Poinsettia Elementary School, Anacapa Middle School, and Buena High School.
Ownership History
Date
Name
Owned For
Owner Type
Purchase Details
Closed on
Jan 6, 2025
Sold by
Armes Rita Paulette
Bought by
Rita Armes Trust and Armes
Current Estimated Value
Purchase Details
Closed on
Nov 15, 2024
Sold by
Bruno Rita Paulette and Sale Amelia Christine
Bought by
Armes Rita Paulette
Purchase Details
Closed on
Jul 28, 2020
Sold by
Bruno Tom E and The Tom E Bruno Trust
Bought by
Bruno Tom H and The Tom E Bruno Trust
Purchase Details
Closed on
Jan 16, 2019
Sold by
Bruno Thomas E
Bought by
Bruno Thomas E and Thomas E Bruno Trust
Purchase Details
Closed on
Feb 11, 2016
Sold by
Bruno Thomas E
Bought by
Bruno Thomas E
Purchase Details
Closed on
Mar 22, 2013
Sold by
Bruno Thomas E
Bought by
Bruno Thomas E
Purchase Details
Closed on
Oct 18, 2012
Sold by
Bruno Thomas E
Bought by
Bruno Thomas E
Purchase Details
Closed on
Feb 26, 2003
Sold by
Bruno Thomas E and Bruno Rosemary A
Bought by
Bruno Thomas E and Bruno Rosemary A
Create a Home Valuation Report for This Property
The Home Valuation Report is an in-depth analysis detailing your home's value as well as a comparison with similar homes in the area
Home Values in the Area
Average Home Value in this Area
Purchase History
| Date | Buyer | Sale Price | Title Company |
|---|---|---|---|
| Rita Armes Trust | -- | None Listed On Document | |
| Armes Rita Paulette | -- | None Listed On Document | |
| Bruno Tom H | -- | None Available | |
| Bruno Thomas E | -- | None Available | |
| Bruno Thomas E | -- | None Available | |
| Bruno Thomas E | -- | None Available | |
| Bruno Thomas E | -- | None Available | |
| Bruno Thomas E | -- | -- |
Source: Public Records
Tax History Compared to Growth
Tax History
| Year | Tax Paid | Tax Assessment Tax Assessment Total Assessment is a certain percentage of the fair market value that is determined by local assessors to be the total taxable value of land and additions on the property. | Land | Improvement |
|---|---|---|---|---|
| 2025 | $992 | $89,080 | $21,895 | $67,185 |
| 2024 | $992 | $87,334 | $21,466 | $65,868 |
| 2023 | $981 | $85,622 | $21,045 | $64,577 |
| 2022 | $918 | $83,944 | $20,633 | $63,311 |
| 2021 | $902 | $82,299 | $20,229 | $62,070 |
| 2020 | $894 | $81,458 | $20,023 | $61,435 |
| 2019 | $878 | $79,862 | $19,631 | $60,231 |
| 2018 | $864 | $78,297 | $19,247 | $59,050 |
| 2017 | $848 | $76,763 | $18,870 | $57,893 |
| 2016 | $834 | $75,258 | $18,500 | $56,758 |
| 2015 | $821 | $74,129 | $18,223 | $55,906 |
| 2014 | $810 | $72,679 | $17,867 | $54,812 |
Source: Public Records
Map
Nearby Homes
- 572 Skyline Rd
- 288 Byron Ave
- 275 Fairfax Ave
- 5438 Rainier St
- 412 Dayloma Ave
- 262 Crestwood Ave
- 5633 Pembroke St
- 4797 Loma Vista Rd
- 6005 Sutter St
- 6153 Cobblestone Dr
- 6174 Cobblestone Dr
- 201 Xavier Ave
- 5535 Larkin St
- 159 Donner Ave
- 146 Donner Ave
- 5365 Queens St
- 91 Mount Whitney Ct
- 4205 Foothill Rd
- 6019 Cloverly St
- 322 S Victoria Ave
- 380 Teloma Dr
- 393 Teloma Dr
- 449 Arnett Ave
- 5260 Foothill Rd
- 5280 Foothill Rd
- 433 Arnett Ave
- 381 Teloma Dr
- 366 Teloma Dr
- 417 Arnett Ave
- 5340 Foothill Rd
- 490 Heidelberg Ave
- 367 Teloma Dr
- 484 Heidelberg Ave
- 354 Teloma Dr
- 403 Arnett Ave
- 478 Heidelberg Ave
- 444 Arnett Ave
- 355 Teloma Dr
- 5200 Foothill Rd
- 465 Arnett Ave