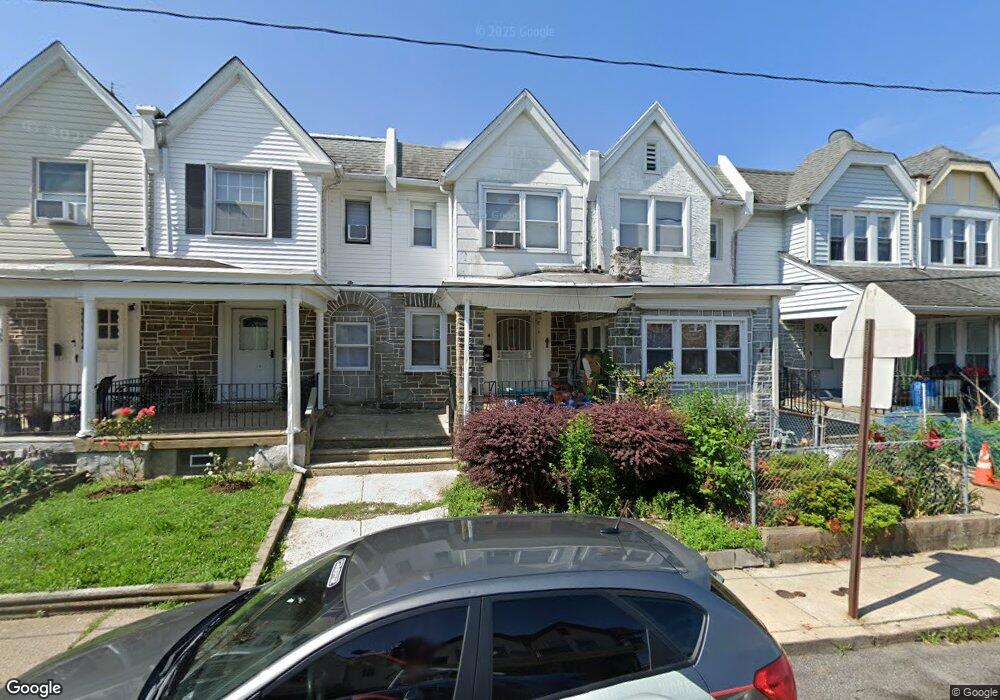
392 Wembly Rd Upper Darby, PA 19082
Estimated Value: $182,000 - $199,000
3
Beds
1
Bath
1,227
Sq Ft
$155/Sq Ft
Est. Value
About This Home
This home is located at 392 Wembly Rd, Upper Darby, PA 19082 and is currently estimated at $190,603, approximately $155 per square foot. 392 Wembly Rd is a home located in Delaware County with nearby schools including Bywood Elementary School, Upper Darby Kdg Center, and Upper Darby High School.
Ownership History
Date
Name
Owned For
Owner Type
Purchase Details
Closed on
May 23, 2008
Sold by
Vanscoyk Shirley A
Bought by
Bailey Delta V
Current Estimated Value
Home Financials for this Owner
Home Financials are based on the most recent Mortgage that was taken out on this home.
Original Mortgage
$93,000
Outstanding Balance
$59,601
Interest Rate
6.11%
Mortgage Type
Purchase Money Mortgage
Estimated Equity
$131,002
Purchase Details
Closed on
Apr 3, 2007
Sold by
Daniel Beatrice V and Daniel Elizabeth
Bought by
Vanscoyk Shirley A
Create a Home Valuation Report for This Property
The Home Valuation Report is an in-depth analysis detailing your home's value as well as a comparison with similar homes in the area
Home Values in the Area
Average Home Value in this Area
Purchase History
| Date | Buyer | Sale Price | Title Company |
|---|---|---|---|
| Bailey Delta V | $97,900 | Old Republic National Title | |
| Vanscoyk Shirley A | $41,200 | None Available |
Source: Public Records
Mortgage History
| Date | Status | Borrower | Loan Amount |
|---|---|---|---|
| Open | Bailey Delta V | $93,000 |
Source: Public Records
Tax History
| Year | Tax Paid | Tax Assessment Tax Assessment Total Assessment is a certain percentage of the fair market value that is determined by local assessors to be the total taxable value of land and additions on the property. | Land | Improvement |
|---|---|---|---|---|
| 2025 | $3,316 | $78,420 | $22,340 | $56,080 |
| 2024 | $3,316 | $78,420 | $22,340 | $56,080 |
| 2023 | $3,285 | $78,420 | $22,340 | $56,080 |
| 2022 | $3,197 | $78,420 | $22,340 | $56,080 |
| 2021 | $4,311 | $78,420 | $22,340 | $56,080 |
| 2020 | $3,111 | $48,090 | $17,380 | $30,710 |
| 2019 | $3,056 | $48,090 | $17,380 | $30,710 |
| 2018 | $3,021 | $48,090 | $0 | $0 |
| 2017 | $2,942 | $48,090 | $0 | $0 |
| 2016 | $264 | $48,090 | $0 | $0 |
| 2015 | $264 | $48,090 | $0 | $0 |
| 2014 | $264 | $48,090 | $0 | $0 |
Source: Public Records
Map
Nearby Homes
- 329 Sanford Rd
- 367 Margate Rd
- 311 Margate Rd
- 305 Margate Rd
- 244 Wembly Rd
- 274 Avon Rd
- 319 Avon Rd
- 7281 Walnut St
- 212 Huntley Rd
- 512 Fairfield Ave
- 7283 Bradford Rd
- 234 Long Ln
- 7124 Pennsylvania Ave
- 232 Long Ln
- 537 Elm Ave
- 129 S Keystone Ave
- 360 Huntley Rd
- 1434 Bywood Ave
- 107 S Keystone Ave
- 232 Copley Rd
Your Personal Tour Guide
Ask me questions while you tour the home.