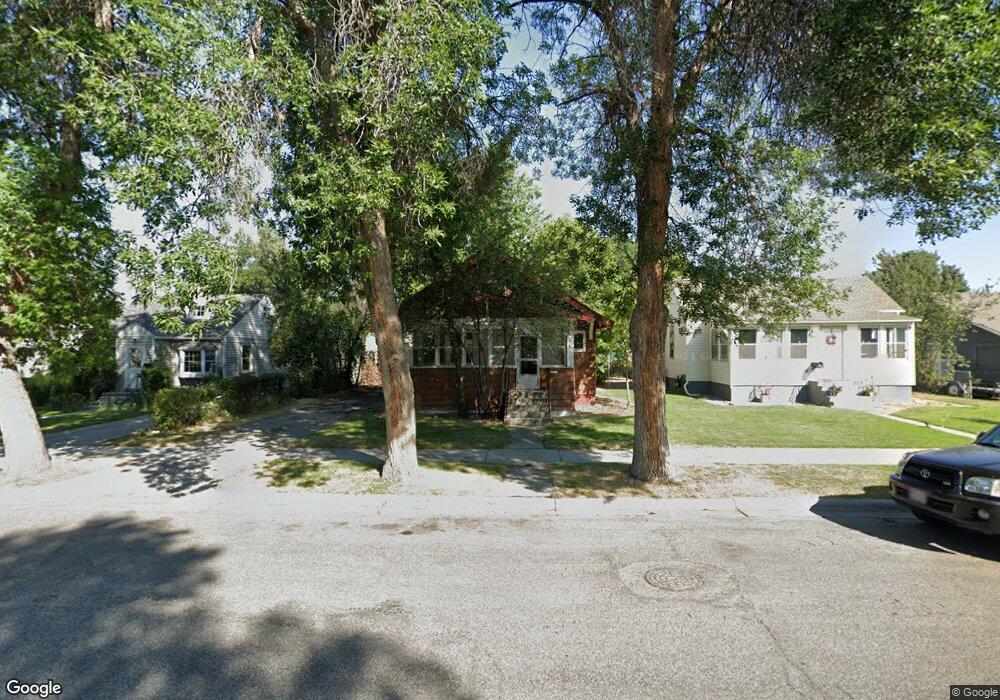
3921 3rd Ave S Billings, MT 59101
South Side NeighborhoodEstimated Value: $230,000 - $250,000
2
Beds
1
Bath
1,076
Sq Ft
$223/Sq Ft
Est. Value
About This Home
This home is located at 3921 3rd Ave S, Billings, MT 59101 and is currently estimated at $239,500, approximately $222 per square foot. 3921 3rd Ave S is a home located in Yellowstone County with nearby schools including Orchard School, Riverside Junior High School, and Billings Senior High School.
Ownership History
Date
Name
Owned For
Owner Type
Purchase Details
Closed on
Dec 31, 2020
Sold by
Us Bank National Association
Bought by
Shelhamer R Shawn R and Shelhamer Nicole R
Current Estimated Value
Purchase Details
Closed on
Dec 5, 2019
Sold by
Heraut Van H
Bought by
Us Bk Natl Assoc
Home Financials for this Owner
Home Financials are based on the most recent Mortgage that was taken out on this home.
Interest Rate
3.68%
Create a Home Valuation Report for This Property
The Home Valuation Report is an in-depth analysis detailing your home's value as well as a comparison with similar homes in the area
Home Values in the Area
Average Home Value in this Area
Purchase History
| Date | Buyer | Sale Price | Title Company |
|---|---|---|---|
| Shelhamer R Shawn R | $68,500 | Premier Title | |
| Us Bk Natl Assoc | -- | -- |
Source: Public Records
Mortgage History
| Date | Status | Borrower | Loan Amount |
|---|---|---|---|
| Previous Owner | Us Bk Natl Assoc | -- |
Source: Public Records
Tax History
| Year | Tax Paid | Tax Assessment Tax Assessment Total Assessment is a certain percentage of the fair market value that is determined by local assessors to be the total taxable value of land and additions on the property. | Land | Improvement |
|---|---|---|---|---|
| 2025 | $1,898 | $226,600 | $39,332 | $187,268 |
| 2024 | $1,898 | $181,900 | $38,678 | $143,222 |
| 2023 | $1,901 | $181,900 | $38,678 | $143,222 |
| 2022 | $1,404 | $148,700 | $0 | $0 |
| 2021 | $1,693 | $148,700 | $0 | $0 |
| 2020 | $1,632 | $131,600 | $0 | $0 |
| 2019 | $1,555 | $131,600 | $0 | $0 |
| 2018 | $1,630 | $137,600 | $0 | $0 |
| 2017 | $1,583 | $137,600 | $0 | $0 |
| 2016 | $1,523 | $133,100 | $0 | $0 |
| 2015 | $1,482 | $133,100 | $0 | $0 |
| 2014 | $1,201 | $55,173 | $0 | $0 |
Source: Public Records
Map
Nearby Homes
Your Personal Tour Guide
Ask me questions while you tour the home.