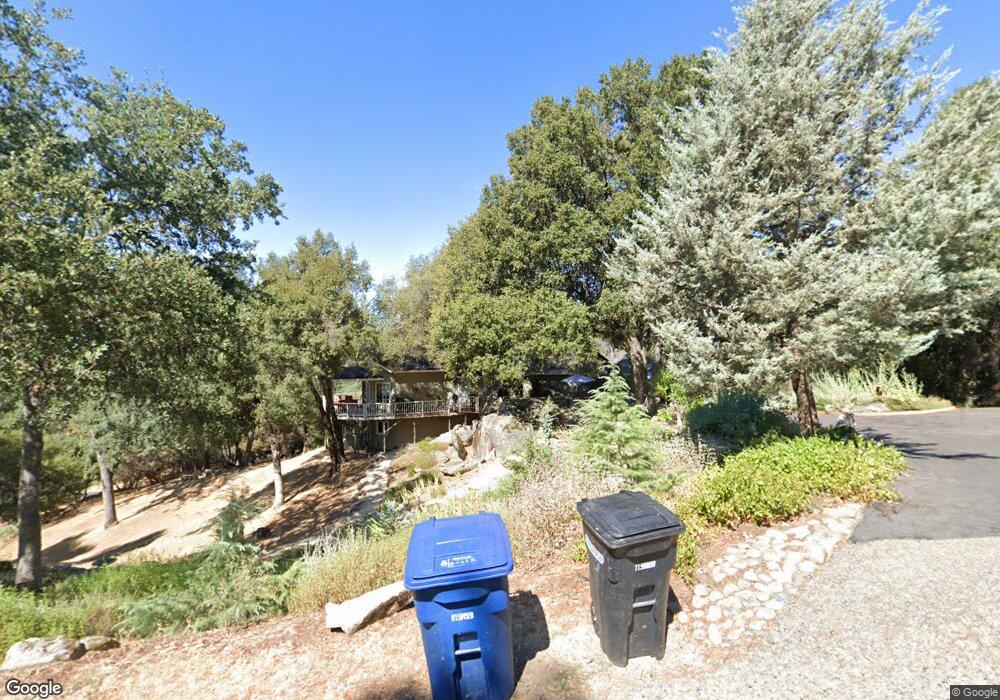
39210 Thornberry Mtn View Ct Oakhurst, CA 93644
Estimated Value: $477,000 - $550,000
3
Beds
2
Baths
2,010
Sq Ft
$259/Sq Ft
Est. Value
About This Home
This home is located at 39210 Thornberry Mtn View Ct, Oakhurst, CA 93644 and is currently estimated at $520,106, approximately $258 per square foot. 39210 Thornberry Mtn View Ct is a home located in Madera County with nearby schools including Oakhurst Elementary School, Oak Creek Intermediate School, and Oakhurst Seventh-day Adventist School.
Ownership History
Date
Name
Owned For
Owner Type
Purchase Details
Closed on
Mar 17, 2010
Sold by
Bratty Robert T and Bratty Drusilla E
Bought by
Bratty Troy A and Bratty Heather M
Current Estimated Value
Purchase Details
Closed on
Feb 26, 2009
Sold by
Bratty Robert T and Bratty Drusilla E
Bought by
Bratty Robert T and Bratty Drusilla E
Purchase Details
Closed on
Jul 24, 2001
Sold by
State Street Bank & Trust Company
Bought by
Bratty Robert T and Bratty Drusilla E
Home Financials for this Owner
Home Financials are based on the most recent Mortgage that was taken out on this home.
Original Mortgage
$129,000
Outstanding Balance
$39,639
Interest Rate
4.35%
Estimated Equity
$480,467
Purchase Details
Closed on
Feb 2, 2001
Sold by
Hard Shannon L and Hard Shonnie R
Bought by
State Street Bank & Trust Company
Create a Home Valuation Report for This Property
The Home Valuation Report is an in-depth analysis detailing your home's value as well as a comparison with similar homes in the area
Home Values in the Area
Average Home Value in this Area
Purchase History
| Date | Buyer | Sale Price | Title Company |
|---|---|---|---|
| Bratty Troy A | -- | None Available | |
| Bratty Robert T | -- | None Available | |
| Bratty Robert T | $229,000 | Stewart Title | |
| State Street Bank & Trust Company | $200,000 | First American Title Ins Co |
Source: Public Records
Mortgage History
| Date | Status | Borrower | Loan Amount |
|---|---|---|---|
| Open | Bratty Robert T | $129,000 |
Source: Public Records
Tax History Compared to Growth
Tax History
| Year | Tax Paid | Tax Assessment Tax Assessment Total Assessment is a certain percentage of the fair market value that is determined by local assessors to be the total taxable value of land and additions on the property. | Land | Improvement |
|---|---|---|---|---|
| 2025 | $3,506 | $338,282 | $127,038 | $211,244 |
| 2023 | $3,506 | $325,148 | $122,106 | $203,042 |
| 2022 | $3,404 | $318,773 | $119,712 | $199,061 |
| 2021 | $3,358 | $312,523 | $117,365 | $195,158 |
| 2020 | $3,341 | $309,319 | $116,162 | $193,157 |
| 2019 | $3,280 | $303,255 | $113,885 | $189,370 |
| 2018 | $3,204 | $297,309 | $111,652 | $185,657 |
| 2017 | $3,147 | $291,480 | $109,463 | $182,017 |
| 2016 | $3,048 | $285,766 | $107,317 | $178,449 |
| 2015 | $3,008 | $281,474 | $105,705 | $175,769 |
| 2014 | $2,961 | $275,961 | $103,635 | $172,326 |
Source: Public Records
Map
Nearby Homes
- 51793 Quail Ridge Rd
- 51892 Quail Ridge Rd
- 11 Suncrest Dr
- 51668 Courtney Ln
- 51571 Coyote Ridge Rd
- 39712 Deer Ridge Dr
- 52038 Road 426
- 52815 Balsam Dr
- 39314 Manzanita Dr
- 52854 Balsam Dr
- 52830 Pine Dr
- 52861 Cedar Dr
- 51259 Bon Veu Dr
- 51192 Bon Veu Dr
- 38475 Sierra Lakes Dr
- 39427 Manzanita Dr
- 38601 Bon Veu Cir
- 3 Road 423
- 28 Rusty Ln
- 38090 Wortham Rd
- 39207 Thornberry Mountain View Ct
- 52040 Echo Valley View Ct
- 51945 Mountain Quail Place
- 39282 Thornberry Mountain View Ct
- 39282 Thornberry Mountain View Ct
- 51960 Mountain Quail Place
- 0 Echo Valley View Ct
- 1 Echo Valley View Ct
- 0 Echo Valley View Ct Unit 537879
- 0 Echo Valley View Ct Unit FR20040431
- 52156 Echo Valley View Ct
- 51909 Mountain Quail Place
- 51934 Mountain Quail Place
- 51300 Road 426
- 51899 Quail Ridge Rd
- 51951 Quail Ridge Rd
- 51900 Dale Ln
- 39263 Thornberry Mountain View Ct
- 39263 Thornberry Mountain View Ct
- 51847 Quail Ridge Rd