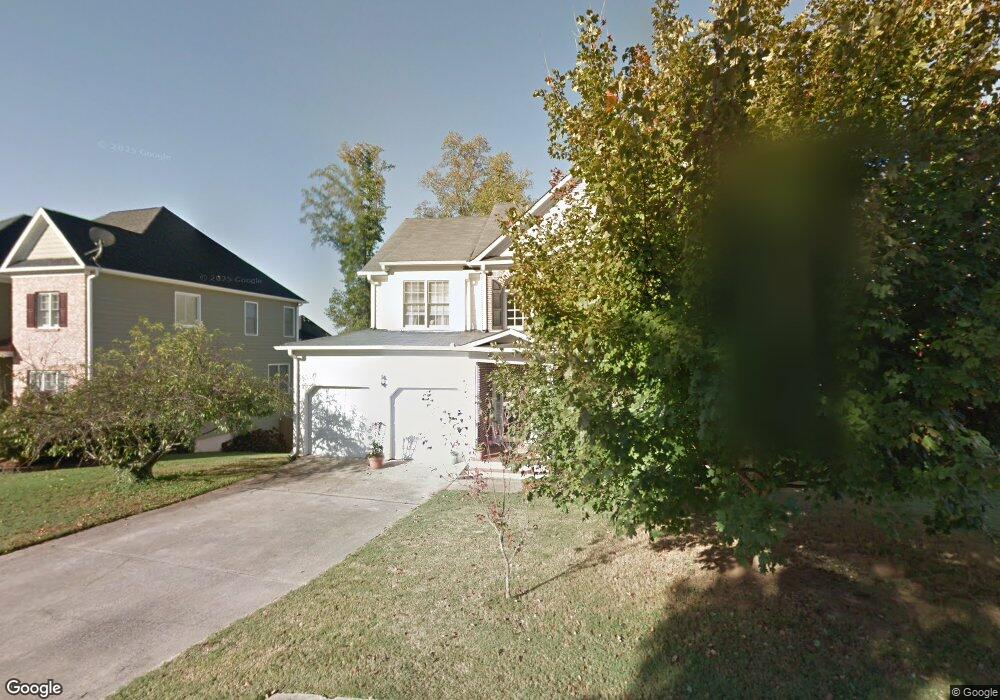
3922 Concord Walk Dr SE Unit 2A Smyrna, GA 30082
Estimated Value: $486,000 - $567,000
4
Beds
4
Baths
1,969
Sq Ft
$268/Sq Ft
Est. Value
About This Home
This home is located at 3922 Concord Walk Dr SE Unit 2A, Smyrna, GA 30082 and is currently estimated at $528,276, approximately $268 per square foot. 3922 Concord Walk Dr SE Unit 2A is a home located in Cobb County with nearby schools including King Springs Elementary School, Griffin Middle School, and Campbell High School.
Ownership History
Date
Name
Owned For
Owner Type
Purchase Details
Closed on
Aug 8, 2005
Sold by
Carlock William J and Carlock Magdalen
Bought by
Dwyer Margaret L
Current Estimated Value
Home Financials for this Owner
Home Financials are based on the most recent Mortgage that was taken out on this home.
Original Mortgage
$200,000
Interest Rate
5.48%
Mortgage Type
New Conventional
Purchase Details
Closed on
Sep 24, 2001
Sold by
Hurst Douglas R and Hurst Rosa L
Bought by
Ayo Magdalen E
Home Financials for this Owner
Home Financials are based on the most recent Mortgage that was taken out on this home.
Original Mortgage
$196,650
Interest Rate
6.89%
Mortgage Type
New Conventional
Purchase Details
Closed on
Nov 30, 1998
Sold by
Exceptional Hms Inc
Bought by
Hurst Douglas R and Hurst Rosa I
Home Financials for this Owner
Home Financials are based on the most recent Mortgage that was taken out on this home.
Original Mortgage
$174,482
Interest Rate
6.77%
Mortgage Type
VA
Create a Home Valuation Report for This Property
The Home Valuation Report is an in-depth analysis detailing your home's value as well as a comparison with similar homes in the area
Home Values in the Area
Average Home Value in this Area
Purchase History
| Date | Buyer | Sale Price | Title Company |
|---|---|---|---|
| Dwyer Margaret L | $250,000 | -- | |
| Ayo Magdalen E | $207,000 | -- | |
| Hurst Douglas R | $169,400 | -- |
Source: Public Records
Mortgage History
| Date | Status | Borrower | Loan Amount |
|---|---|---|---|
| Closed | Dwyer Margaret L | $200,000 | |
| Previous Owner | Ayo Magdalen E | $196,650 | |
| Previous Owner | Hurst Douglas R | $174,482 |
Source: Public Records
Tax History Compared to Growth
Tax History
| Year | Tax Paid | Tax Assessment Tax Assessment Total Assessment is a certain percentage of the fair market value that is determined by local assessors to be the total taxable value of land and additions on the property. | Land | Improvement |
|---|---|---|---|---|
| 2025 | $5,097 | $187,672 | $38,000 | $149,672 |
| 2024 | $5,097 | $187,672 | $38,000 | $149,672 |
| 2023 | $4,925 | $181,332 | $32,000 | $149,332 |
| 2022 | $4,185 | $152,952 | $32,000 | $120,952 |
| 2021 | $3,969 | $144,384 | $32,000 | $112,384 |
| 2020 | $3,969 | $144,384 | $32,000 | $112,384 |
| 2019 | $3,540 | $128,784 | $32,000 | $96,784 |
| 2018 | $3,540 | $128,784 | $32,000 | $96,784 |
| 2017 | $2,824 | $109,492 | $26,000 | $83,492 |
| 2016 | $2,824 | $109,492 | $26,000 | $83,492 |
| 2015 | $2,554 | $96,740 | $24,000 | $72,740 |
| 2014 | $2,578 | $96,740 | $0 | $0 |
Source: Public Records
Map
Nearby Homes
- 1375 Mosswood Ln SE
- 203 Angla Dr SE
- 3808 Concord Approach Way SE
- 63 Geraldine Dr SE
- 14 Geraldine Dr SE
- 22 Geraldine Dr SE
- 18 Geraldine Dr SE
- 362 Doeskin Ln SE
- 524 Tackett Farms Rd
- 4135 Fawn Ln SE
- 2508 Haddenham Ln SW
- 4025 Benell Ct SE
- 22 Vanessa Dr SE Unit 8
- 317 Highview Dr SE
- 4195 Antler Trail SE
- 3664 Nessa Ct SE
- 4246 Antler Trail SE
- 4094 Norton Place SE
- 321 Covered Bridge Place SW
- 418 Mockingbird Ln SE
- 3924 Concord Walk Dr SE
- 3920 Concord Walk Dr SE Unit 2A
- 3918 Concord Walk Dr SE
- 327900 Concord Walk Dr SE
- 3991 Harmony Walk Way SE Unit 1
- 3921 Concord Walk Dr SE
- 3919 Concord Walk Dr SE Unit 2A/78
- 3919 Concord Walk Dr SE
- 3989 Harmony Walk Way SE
- 16 Harmony Walk Place SE
- 18 Harmony Walk Place SE
- 3987 Harmony Walk Way SE Unit 1
- 3923 Concord Walk Dr SE
- 3917 Concord Walk Dr SE Unit None
- 3917 Concord Walk Dr SE
- 3917 Concord Walk Dr SE Unit 3917
- 3916 Concord Walk Dr SE
- 0 Concord Walk Dr SE Unit 8593907
- 0 Concord Walk Dr SE Unit 8546062
- 0 Concord Walk Dr SE Unit 8417934