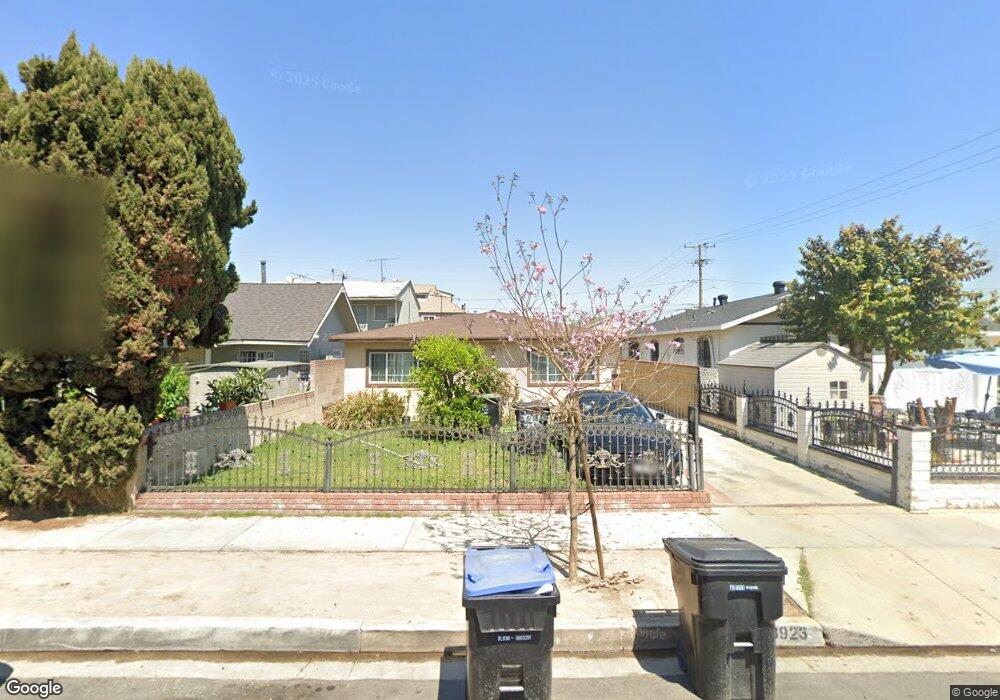
3923 E 54th St Maywood, CA 90270
Estimated Value: $570,490 - $626,000
2
Beds
1
Bath
942
Sq Ft
$635/Sq Ft
Est. Value
About This Home
This home is located at 3923 E 54th St, Maywood, CA 90270 and is currently estimated at $597,873, approximately $634 per square foot. 3923 E 54th St is a home located in Los Angeles County with nearby schools including Fishburn Avenue Elementary School, Chester W. Nimitz Middle School, and Maywood Academy High School.
Ownership History
Date
Name
Owned For
Owner Type
Purchase Details
Closed on
Mar 27, 2000
Sold by
Sandoval Felix
Bought by
Pena Aureliano and Pena Julia
Current Estimated Value
Home Financials for this Owner
Home Financials are based on the most recent Mortgage that was taken out on this home.
Original Mortgage
$105,300
Interest Rate
8.08%
Mortgage Type
Purchase Money Mortgage
Purchase Details
Closed on
Feb 11, 1997
Sold by
Robles Irma
Bought by
Sandoval Felix and Sandoval Irma
Purchase Details
Closed on
Aug 16, 1996
Sold by
Robles Irma
Bought by
Sandoval Felix and Robles Irma
Home Financials for this Owner
Home Financials are based on the most recent Mortgage that was taken out on this home.
Original Mortgage
$129,600
Interest Rate
8.5%
Purchase Details
Closed on
Apr 28, 1994
Sold by
Sandoval Felix
Bought by
Robles Irma
Create a Home Valuation Report for This Property
The Home Valuation Report is an in-depth analysis detailing your home's value as well as a comparison with similar homes in the area
Home Values in the Area
Average Home Value in this Area
Purchase History
We collect this data history from publicly available records. To have your information removed, we recommend requesting removal directly through your county’s website.
| Date | Buyer | Sale Price | Title Company |
|---|---|---|---|
| Pena Aureliano | $117,000 | Southland Title | |
| Sandoval Felix | -- | -- | |
| Sandoval Felix | -- | South Coast Title Company | |
| Robles Irma | -- | -- |
Source: Public Records
Mortgage History
We collect this data history from publicly available records. To have your information removed, we recommend requesting removal directly through your county’s website.
| Date | Status | Borrower | Loan Amount |
|---|---|---|---|
| Previous Owner | Pena Aureliano | $105,300 | |
| Previous Owner | Sandoval Felix | $129,600 |
Source: Public Records
Tax History
| Year | Tax Paid | Tax Assessment Tax Assessment Total Assessment is a certain percentage of the fair market value that is determined by local assessors to be the total taxable value of land and additions on the property. | Land | Improvement |
|---|---|---|---|---|
| 2025 | $2,965 | $179,799 | $138,624 | $41,175 |
| 2024 | $2,858 | $176,274 | $135,906 | $40,368 |
| 2023 | $2,811 | $172,819 | $133,242 | $39,577 |
| 2022 | $2,701 | $169,431 | $130,630 | $38,801 |
| 2021 | $2,666 | $166,110 | $128,069 | $38,041 |
| 2019 | $2,587 | $161,184 | $124,271 | $36,913 |
| 2018 | $2,493 | $158,025 | $121,835 | $36,190 |
| 2016 | $2,319 | $151,891 | $117,105 | $34,786 |
| 2015 | $2,192 | $149,610 | $115,346 | $34,264 |
| 2014 | $2,192 | $146,680 | $113,087 | $33,593 |
Source: Public Records
Map
Nearby Homes
- 3913 E 55th St
- 3738 E 53rd St
- 4056 E 55th St
- 3700 E 55th St
- 3725 E 57th St
- 3651 E 56th St
- 5117 Everett Ave
- 4361 E 56th St
- 5954 Riverside Ave
- 0 0 Fir Unit 202604501
- 4439 E 52nd Place
- 4301 E 60th St
- 5716 Maywood Ave
- 4535 E 55th St
- 3519 E 60th St
- 3531 E 61st St
- 6048 King Ave
- 3201 3201 Long Beach
- 4026 Gage Ave
- 6522 Bear Ave
- 3925 E 54th St
- 3921 E 54th St Unit A
- 5317 Corona Ave
- 3915 E 54th St
- 5311 Corona Ave
- 3913 E 54th St Unit A
- 4001 E 54th St
- 5316 Corona Ave
- 3924 E 54th St
- 3930 E 54th St
- 3920 E 54th St
- 3909 E 54th St
- 4007 E 54th St
- 3918 E 53rd St
- 3914 E 53rd St
- 3924 E 53rd St
- 3928 E 53rd St
- 3916 E 54th St
- 4002 E 54th St
- 5405 Corona Ave
Your Personal Tour Guide
Ask me questions while you tour the home.