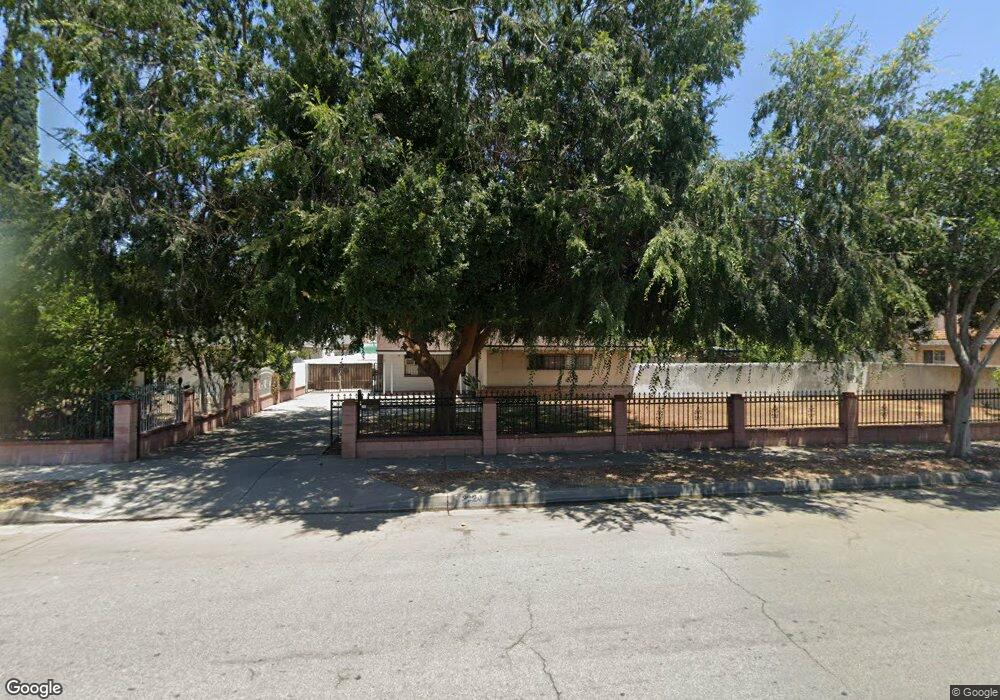
3924 Center St Baldwin Park, CA 91706
Estimated Value: $802,000 - $869,938
3
Beds
2
Baths
1,716
Sq Ft
$493/Sq Ft
Est. Value
About This Home
This home is located at 3924 Center St, Baldwin Park, CA 91706 and is currently estimated at $846,235, approximately $493 per square foot. 3924 Center St is a home located in Los Angeles County with nearby schools including Kenmore Elementary, Olive Middle, and Sierra Vista High.
Ownership History
Date
Name
Owned For
Owner Type
Purchase Details
Closed on
Aug 21, 2007
Sold by
Chiu May Shichao
Bought by
Chiu Andy
Current Estimated Value
Purchase Details
Closed on
May 21, 2007
Sold by
Chiu Robert
Bought by
Chiu May Shichao
Purchase Details
Closed on
Jul 15, 2006
Sold by
Chiu Mike and Chiu Andy W
Bought by
Chiu Andy W
Purchase Details
Closed on
Feb 11, 2006
Sold by
Huang Yi Fang
Bought by
Chiu Mike
Purchase Details
Closed on
Jun 12, 2001
Sold by
Chen Joyce C
Bought by
Chiu Andy W
Home Financials for this Owner
Home Financials are based on the most recent Mortgage that was taken out on this home.
Original Mortgage
$120,000
Interest Rate
7.14%
Purchase Details
Closed on
Jun 11, 2001
Sold by
Chiu Shen Wang and Wu Hsi Chao Chiu
Bought by
Chiu Mike
Home Financials for this Owner
Home Financials are based on the most recent Mortgage that was taken out on this home.
Original Mortgage
$120,000
Interest Rate
7.14%
Create a Home Valuation Report for This Property
The Home Valuation Report is an in-depth analysis detailing your home's value as well as a comparison with similar homes in the area
Home Values in the Area
Average Home Value in this Area
Purchase History
| Date | Buyer | Sale Price | Title Company |
|---|---|---|---|
| Chiu Andy | -- | None Available | |
| Chiu May Shichao | -- | None Available | |
| Chiu May Shichao | -- | None Available | |
| Chiu Andy W | -- | Accommodation | |
| Chiu Mike | -- | Accommodation | |
| Chiu Mike | -- | Accommodation | |
| Chiu Andy W | -- | Investors Title Company | |
| Chiu Mike | $195,000 | Investors Title Company |
Source: Public Records
Mortgage History
| Date | Status | Borrower | Loan Amount |
|---|---|---|---|
| Previous Owner | Chiu Mike | $120,000 |
Source: Public Records
Tax History
| Year | Tax Paid | Tax Assessment Tax Assessment Total Assessment is a certain percentage of the fair market value that is determined by local assessors to be the total taxable value of land and additions on the property. | Land | Improvement |
|---|---|---|---|---|
| 2025 | $6,342 | $485,858 | $367,725 | $118,133 |
| 2024 | $6,342 | $476,332 | $360,515 | $115,817 |
| 2023 | $6,280 | $466,994 | $353,447 | $113,547 |
| 2022 | $6,401 | $457,838 | $346,517 | $111,321 |
| 2021 | $6,307 | $448,862 | $339,723 | $109,139 |
| 2019 | $5,924 | $435,550 | $329,648 | $105,902 |
| 2018 | $5,542 | $427,011 | $323,185 | $103,826 |
| 2016 | $5,223 | $410,433 | $310,637 | $99,796 |
| 2015 | $5,371 | $404,268 | $305,971 | $98,297 |
| 2014 | $5,298 | $396,350 | $299,978 | $96,372 |
Source: Public Records
Map
Nearby Homes
- 13636 Ramona Pkwy
- 4059 Grace Ave
- 3819 1/2 Foster Ave
- 4249 Filhurst Ave
- 3727 Foster Ave
- 13826 Susquehanna Ave
- 3902 Bresee Ave Unit 14
- 3817 Athol St
- 3806 Cosbey St
- 3729 Baldwin Park Blvd
- 13721 Los Angeles St
- 13813 Los Angeles St
- 4227 Benham Ave
- 13655 Foster Ave Unit 2
- 4459 Merced Ave
- 13653 Foster Ave Unit 1
- 4155 Baldwin Park Blvd Unit B
- 14122 Merced Ave
- 13811 Durness St
- 4612 Walnut St
- 3914 Center St
- 3932 Center St
- 13618 Valle Vista Ave
- 13622 Valle Vista Ave
- 13611 Ramona Pkwy
- 13607 Ramona Pkwy
- 13601 Ramona Pkwy
- 13530 Valle Vista Ave
- 13626 Valle Vista Ave
- 3915 Center St
- 4008 Center St
- 13627 Ramona Pkwy
- 4005 Center St
- 13623 Valle Vista Ave
- 13630 Valle Vista Ave
- 4014 Center St
- 13627 Valle Vista Ave
- 13635 Ramona Pkwy
- 4011 Center St
- 13511 Ramona Pkwy
Your Personal Tour Guide
Ask me questions while you tour the home.