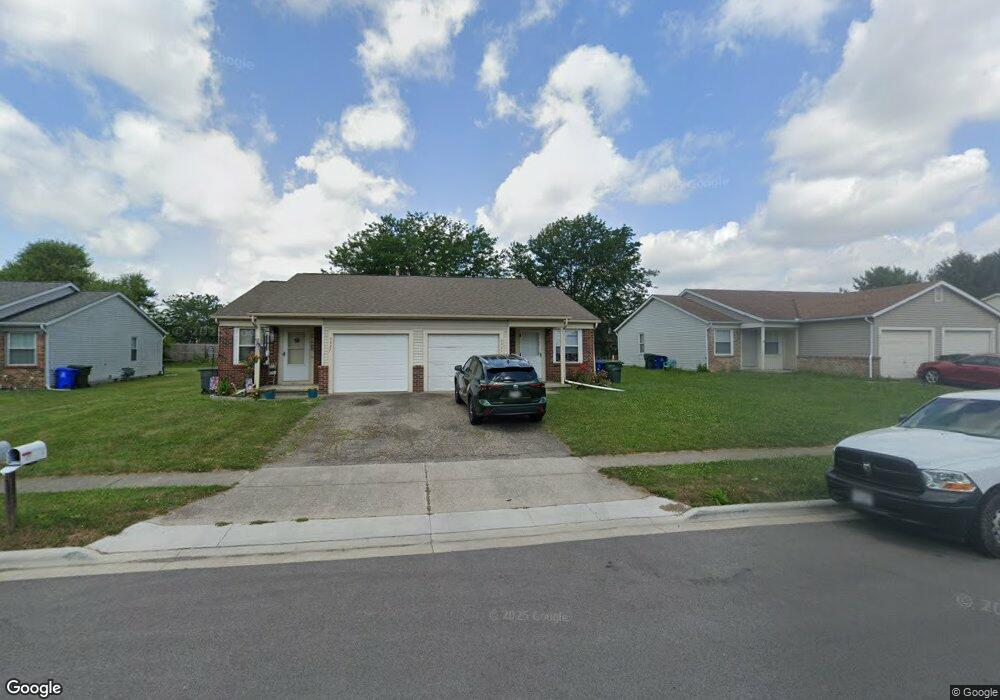
3925 Millstone Rd Unit 927 Columbus, OH 43207
Obetz-Lockbourne NeighborhoodEstimated Value: $263,000 - $280,000
4
Beds
2
Baths
1,920
Sq Ft
$142/Sq Ft
Est. Value
About This Home
This home is located at 3925 Millstone Rd Unit 927, Columbus, OH 43207 and is currently estimated at $273,382, approximately $142 per square foot. 3925 Millstone Rd Unit 927 is a home located in Franklin County with nearby schools including Groveport Madison High School, South Columbus Preparatory Academy at Southfield, and South Scioto Academy.
Ownership History
Date
Name
Owned For
Owner Type
Purchase Details
Closed on
Sep 26, 2007
Sold by
Deutsche Bank Trust Co Americas
Bought by
Joann Barnett Llc
Current Estimated Value
Purchase Details
Closed on
Jul 5, 2007
Sold by
Welsh Bryan J
Bought by
Deutsche Bank Trust Co Americas and Residential Funding Co Llc
Purchase Details
Closed on
Mar 1, 2002
Sold by
Lpi Properties Inc
Bought by
Welsch Bryan J
Home Financials for this Owner
Home Financials are based on the most recent Mortgage that was taken out on this home.
Original Mortgage
$101,000
Interest Rate
9.2%
Mortgage Type
Purchase Money Mortgage
Purchase Details
Closed on
Jun 15, 2001
Sold by
Liberty Svgs Bank Fsb
Bought by
Lpi Properties Inc
Purchase Details
Closed on
Jan 11, 1988
Create a Home Valuation Report for This Property
The Home Valuation Report is an in-depth analysis detailing your home's value as well as a comparison with similar homes in the area
Home Values in the Area
Average Home Value in this Area
Purchase History
| Date | Buyer | Sale Price | Title Company |
|---|---|---|---|
| Joann Barnett Llc | $85,000 | Accutitle Agency Inc | |
| Deutsche Bank Trust Co Americas | $76,000 | None Available | |
| Welsch Bryan J | $101,000 | -- | |
| Lpi Properties Inc | $159,900 | -- | |
| -- | $48,000 | -- |
Source: Public Records
Mortgage History
| Date | Status | Borrower | Loan Amount |
|---|---|---|---|
| Previous Owner | Welsch Bryan J | $101,000 |
Source: Public Records
Tax History
| Year | Tax Paid | Tax Assessment Tax Assessment Total Assessment is a certain percentage of the fair market value that is determined by local assessors to be the total taxable value of land and additions on the property. | Land | Improvement |
|---|---|---|---|---|
| 2025 | $3,664 | $84,420 | $19,250 | $65,170 |
| 2024 | $3,664 | $84,420 | $19,250 | $65,170 |
| 2023 | $3,630 | $84,420 | $19,250 | $65,170 |
| 2022 | $1,421 | $27,480 | $8,090 | $19,390 |
| 2021 | $1,425 | $27,480 | $8,090 | $19,390 |
| 2020 | $1,427 | $27,480 | $8,090 | $19,390 |
| 2019 | $1,389 | $23,910 | $7,040 | $16,870 |
| 2018 | $1,929 | $23,910 | $7,040 | $16,870 |
| 2017 | $1,402 | $23,910 | $7,040 | $16,870 |
| 2016 | $2,433 | $37,910 | $7,280 | $30,630 |
| 2015 | $2,460 | $37,910 | $7,280 | $30,630 |
| 2014 | $2,487 | $37,910 | $7,280 | $30,630 |
| 2013 | $1,100 | $39,900 | $7,665 | $32,235 |
Source: Public Records
Map
Nearby Homes
- 3847 Pendent Ln
- 3768 Pendent Ln
- 4142 Oldentime Ct
- 3782 Willowtree Ln
- 3950 Wintercress Ct
- 3939 Marsha Dr
- 3688 Tea Party Place Unit 273
- 2629 Patrick Henry Ave Unit 40
- 4310 Charlotte Rd
- 3516 Meadow Valley St
- 2535 Bridlewood Ct
- 2366 E Howard Rd
- 2883 Valley Green Dr
- 2291 E Howard Rd
- 2681 Meigs Dr
- 2685 Meigs Dr
- 2689 Meigs Dr
- 2693 Meigs Dr
- 2697 Meigs Dr
- 2674 Meigs Dr
- 3925-3927 Millstone Rd
- 3917-3919 Millstone Rd
- 3917 Millstone Rd Unit 919
- 3939 Millstone Rd Unit 941
- 3939-3941 Millstone Rd
- 3941 Millstone Rd
- 3911-3913 Millstone Rd
- 3911 Millstone Rd Unit 913
- 3911 Millstone Rd Unit 3913
- 3953 Millstone Rd Unit 955
- 2561 Millrace Dr
- 3942 Millstone Rd
- 3950 Millstone Rd
- 3897 Millstone Rd Unit 899
- 3961 Millstone Rd Unit 963
- 2566 Millrace Dr
- 3958 Millstone Rd
- 2575 Millrace Dr
- 3889 + 38 Millstone Rd
- 3889 Millstone Rd Unit 891
Your Personal Tour Guide
Ask me questions while you tour the home.