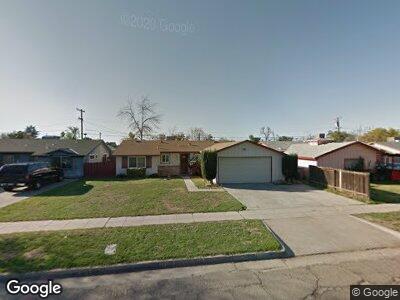
3926 E Buckingham Way Fresno, CA 93726
McLane NeighborhoodEstimated Value: $282,000 - $334,000
3
Beds
2
Baths
1,130
Sq Ft
$274/Sq Ft
Est. Value
About This Home
This home is located at 3926 E Buckingham Way, Fresno, CA 93726 and is currently estimated at $309,379, approximately $273 per square foot. 3926 E Buckingham Way is a home located in Fresno County with nearby schools including Centennial Elementary School, Tioga Middle School, and Herbert Hoover High School.
Ownership History
Date
Name
Owned For
Owner Type
Purchase Details
Closed on
Dec 1, 2020
Sold by
Carrillo Felicitas S
Bought by
Carrillo Felicitas S and Martinez Elvis Pulido
Current Estimated Value
Home Financials for this Owner
Home Financials are based on the most recent Mortgage that was taken out on this home.
Original Mortgage
$91,167
Outstanding Balance
$82,464
Interest Rate
2.7%
Mortgage Type
FHA
Estimated Equity
$245,825
Purchase Details
Closed on
Mar 5, 2009
Sold by
Dumont Paul H and Dumont Tamara D
Bought by
Carrillo Felicitas S
Home Financials for this Owner
Home Financials are based on the most recent Mortgage that was taken out on this home.
Original Mortgage
$114,880
Interest Rate
5.15%
Mortgage Type
FHA
Purchase Details
Closed on
Jun 27, 2001
Sold by
Dumont Paul H
Bought by
Dumont Paul H and Dumont Tamara D
Create a Home Valuation Report for This Property
The Home Valuation Report is an in-depth analysis detailing your home's value as well as a comparison with similar homes in the area
Home Values in the Area
Average Home Value in this Area
Purchase History
| Date | Buyer | Sale Price | Title Company |
|---|---|---|---|
| Carrillo Felicitas S | -- | Accommodation | |
| Carrillo Felicitas S | $117,000 | Placer Title Company | |
| Dumont Paul H | -- | -- |
Source: Public Records
Mortgage History
| Date | Status | Borrower | Loan Amount |
|---|---|---|---|
| Open | Carrillo Felicitas S | $91,167 | |
| Closed | Carrillo Felicitas S | $114,880 | |
| Previous Owner | Dumont Paul H | $50,000 |
Source: Public Records
Tax History Compared to Growth
Tax History
| Year | Tax Paid | Tax Assessment Tax Assessment Total Assessment is a certain percentage of the fair market value that is determined by local assessors to be the total taxable value of land and additions on the property. | Land | Improvement |
|---|---|---|---|---|
| 2023 | $1,855 | $144,806 | $49,504 | $95,302 |
| 2022 | $1,830 | $141,968 | $48,534 | $93,434 |
| 2021 | $1,780 | $139,185 | $47,583 | $91,602 |
| 2020 | $1,773 | $137,759 | $47,096 | $90,663 |
| 2019 | $1,705 | $135,059 | $46,173 | $88,886 |
| 2018 | $1,668 | $132,412 | $45,268 | $87,144 |
| 2017 | $1,640 | $129,817 | $44,381 | $85,436 |
| 2016 | $1,586 | $127,272 | $43,511 | $83,761 |
| 2015 | $1,562 | $125,361 | $42,858 | $82,503 |
| 2014 | $1,533 | $122,906 | $42,019 | $80,887 |
Source: Public Records
Map
Nearby Homes
- 3774 E Austin Way
- 4233 E Buckingham Way
- 3854 E Holland Ave
- 3814 E Holland Ave
- 4321 E Buckingham Way
- 3757 E Farrin Ave
- 4336 E Austin Way
- 3906 E Indianapolis Ave
- 3752 E Saginaw Way
- 4002 E Dakota Ave
- 3852 E Dakota Ave
- 4481 E Holland Ave
- 4438 E Dakota Ave
- 3356 E Austin Way
- 3328 E Ashlan Ave
- 3919 E Pico Ave
- 3347 E Richert Ave
- 3948 E Fedora Ave
- 3907 E Dayton Ave
- 4733 N Cedar Ave Unit 115
- 3926 E Buckingham Way
- 3936 E Buckingham Way
- 3916 E Buckingham Way
- 3925 E Hampton Way
- 3946 E Buckingham Way
- 3935 E Hampton Way
- 3915 E Hampton Way
- 3906 E Buckingham Way
- 3945 E Hampton Way
- 3905 E Hampton Way
- 4004 E Buckingham Way
- 3923 E Buckingham Way
- 3933 E Buckingham Way
- 3898 E Buckingham Way
- 3913 E Buckingham Way
- 3943 E Buckingham Way
- 4003 E Hampton Way
- 3899 E Hampton Way
- 3903 E Buckingham Way
- 4001 E Buckingham Way