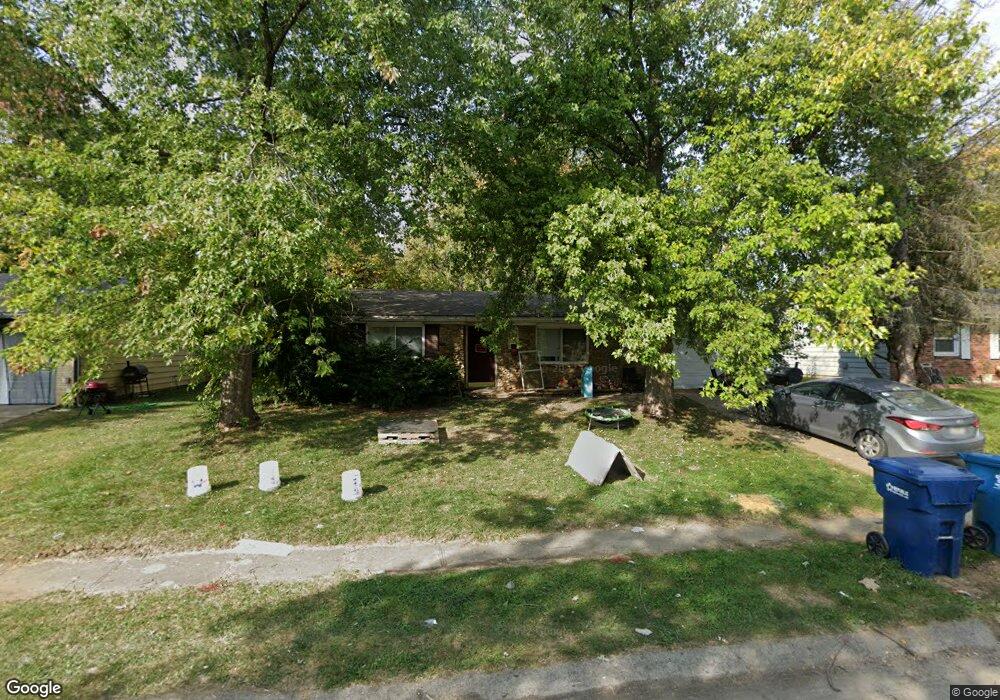
3926 Marietta Ct Indianapolis, IN 46235
Far Eastside NeighborhoodEstimated Value: $154,530 - $202,000
3
Beds
2
Baths
1,212
Sq Ft
$142/Sq Ft
Est. Value
About This Home
This home is located at 3926 Marietta Ct, Indianapolis, IN 46235 and is currently estimated at $172,633, approximately $142 per square foot. 3926 Marietta Ct is a home located in Marion County with nearby schools including Robert Lee Frost School 106, James Whitcomb Riley School 43, and PLA@103.
Ownership History
Date
Name
Owned For
Owner Type
Purchase Details
Closed on
Oct 16, 2024
Sold by
Czarnecki Jung Hur and Czarnecki Remigiusz
Bought by
Czarnecki Family 2008 Trust and Czarnecki
Current Estimated Value
Purchase Details
Closed on
Sep 15, 2008
Sold by
Ib Property Holdings Llc
Bought by
Czarnecki Jung Hur and Czarnecki Remingiusz
Purchase Details
Closed on
Jul 21, 2008
Sold by
Blanche Steven and Blanche Diana
Bought by
Ib Property Holdings Llc
Purchase Details
Closed on
Jun 29, 2006
Sold by
Main Thomas P
Bought by
Bayview Financial Property Trust
Purchase Details
Closed on
Jun 30, 2004
Sold by
Short David F
Bought by
Main Thomas P
Home Financials for this Owner
Home Financials are based on the most recent Mortgage that was taken out on this home.
Original Mortgage
$61,000
Interest Rate
5.83%
Mortgage Type
New Conventional
Create a Home Valuation Report for This Property
The Home Valuation Report is an in-depth analysis detailing your home's value as well as a comparison with similar homes in the area
Home Values in the Area
Average Home Value in this Area
Purchase History
| Date | Buyer | Sale Price | Title Company |
|---|---|---|---|
| Czarnecki Family 2008 Trust | -- | None Listed On Document | |
| Czarnecki Jung Hur | -- | Homequest Title Llc | |
| Ib Property Holdings Llc | -- | None Available | |
| Bayview Financial Property Trust | -- | Mid America Title Co | |
| Main Thomas P | -- | None Available |
Source: Public Records
Mortgage History
| Date | Status | Borrower | Loan Amount |
|---|---|---|---|
| Previous Owner | Main Thomas P | $61,000 |
Source: Public Records
Tax History Compared to Growth
Tax History
| Year | Tax Paid | Tax Assessment Tax Assessment Total Assessment is a certain percentage of the fair market value that is determined by local assessors to be the total taxable value of land and additions on the property. | Land | Improvement |
|---|---|---|---|---|
| 2024 | $2,261 | $91,600 | $10,700 | $80,900 |
| 2023 | $2,261 | $91,600 | $10,700 | $80,900 |
| 2022 | $1,956 | $79,200 | $10,700 | $68,500 |
| 2021 | $1,614 | $66,300 | $10,700 | $55,600 |
| 2020 | $1,460 | $59,500 | $3,900 | $55,600 |
| 2019 | $1,485 | $59,500 | $3,900 | $55,600 |
| 2018 | $1,577 | $62,900 | $3,900 | $59,000 |
| 2017 | $1,391 | $61,900 | $3,900 | $58,000 |
| 2016 | $1,324 | $60,100 | $3,900 | $56,200 |
| 2014 | $1,464 | $67,700 | $3,900 | $63,800 |
| 2013 | $1,595 | $76,700 | $3,900 | $72,800 |
Source: Public Records
Map
Nearby Homes
- 3943 N Mitthoefer Rd
- 10113 Catalina Dr
- 3955 Delmont Dr
- 9925 Catalina Dr
- 4106 Candy Apple Blvd
- 10427 Apple Creek Dr
- 11804 Cotterill Way
- 11738 Cotterill Way
- 11742 Cotterill Way
- 9707 E 39th St
- 9864 Royce Dr
- 10431 Bellchime Ct
- 11917 Vale St
- 11921 Vale St
- 4448 Aristocrat Cir
- 10716 Mistflower Way
- 10662 Lostpine Ln
- 11431 Hartwell St
- 3601 Luewan Dr
- 4411 Ringstead Way
- 3920 Marietta Ct
- 3932 Marietta Ct
- 3925 Kivet Ct
- 3914 Marietta Ct
- 3931 Kivet Ct
- 3919 Kivet Ct
- 3938 Marietta Ct
- 3925 Marietta Ct
- 3919 Marietta Ct
- 3913 Kivet Ct
- 3937 Kivet Ct
- 3908 Marietta Ct
- 3911 Marietta Ct
- 3907 Kivet Ct
- 3937 Marietta Ct
- 3944 Marietta Ct
- 3908 Trilbey Ct
- 3914 Trilbey Ct
- 10030 Catalina Dr
- 10120 Catalina Dr