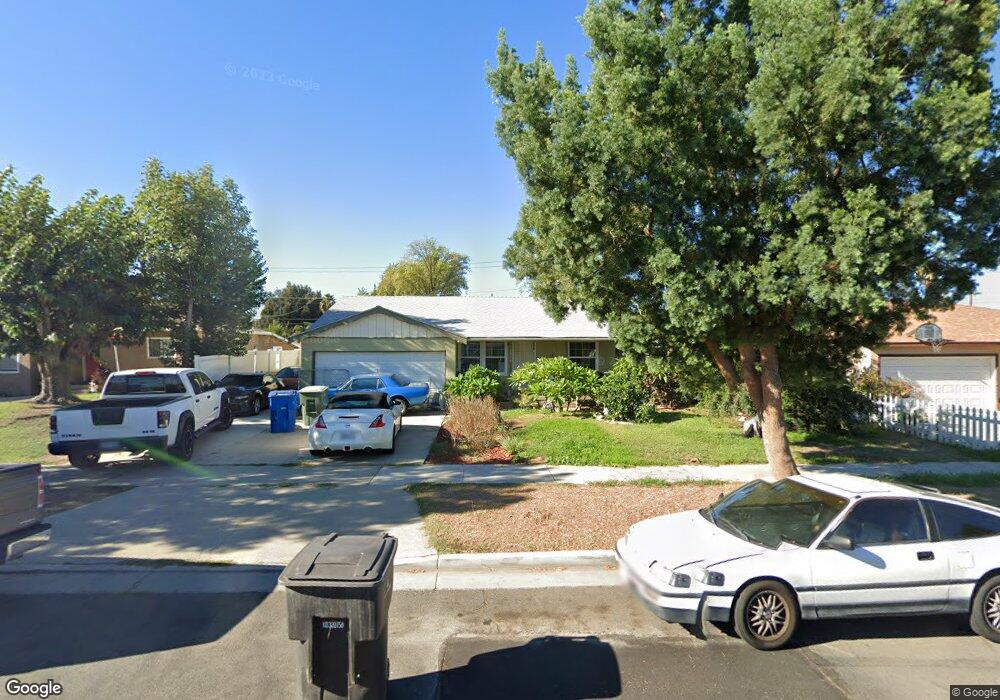
3926 Via San Jose Riverside, CA 92504
Ramona NeighborhoodEstimated Value: $533,000 - $581,000
3
Beds
2
Baths
1,126
Sq Ft
$502/Sq Ft
Est. Value
About This Home
This home is located at 3926 Via San Jose, Riverside, CA 92504 and is currently estimated at $565,086, approximately $501 per square foot. 3926 Via San Jose is a home located in Riverside County with nearby schools including Monroe Elementary School, Chemawa Middle School, and Ramona High School.
Ownership History
Date
Name
Owned For
Owner Type
Purchase Details
Closed on
Oct 7, 2009
Sold by
Bank Of America National Association
Bought by
Ruiz Cynthia
Current Estimated Value
Home Financials for this Owner
Home Financials are based on the most recent Mortgage that was taken out on this home.
Original Mortgage
$126,000
Outstanding Balance
$81,220
Interest Rate
4.83%
Mortgage Type
New Conventional
Estimated Equity
$483,866
Purchase Details
Closed on
Aug 7, 2009
Sold by
Good Darlene
Bought by
Bank Of America National Association
Purchase Details
Closed on
Sep 20, 2002
Sold by
Wright Kathryn A and Wright Katheryn A
Bought by
Good Darlene
Home Financials for this Owner
Home Financials are based on the most recent Mortgage that was taken out on this home.
Original Mortgage
$124,000
Interest Rate
7.1%
Mortgage Type
Purchase Money Mortgage
Purchase Details
Closed on
Dec 18, 2001
Sold by
Wright Robert G
Bought by
Wright Kathryn A
Create a Home Valuation Report for This Property
The Home Valuation Report is an in-depth analysis detailing your home's value as well as a comparison with similar homes in the area
Home Values in the Area
Average Home Value in this Area
Purchase History
| Date | Buyer | Sale Price | Title Company |
|---|---|---|---|
| Ruiz Cynthia | $140,000 | Orange Coast Title Lender Se | |
| Bank Of America National Association | $130,000 | Accommodation | |
| Good Darlene | $155,000 | Chicago Title Co | |
| Wright Kathryn A | -- | Northern Counties Title | |
| Wright Katheryn A | -- | Northern Counties Title |
Source: Public Records
Mortgage History
| Date | Status | Borrower | Loan Amount |
|---|---|---|---|
| Open | Ruiz Cynthia | $126,000 | |
| Previous Owner | Good Darlene | $124,000 | |
| Closed | Good Darlene | $31,000 |
Source: Public Records
Tax History Compared to Growth
Tax History
| Year | Tax Paid | Tax Assessment Tax Assessment Total Assessment is a certain percentage of the fair market value that is determined by local assessors to be the total taxable value of land and additions on the property. | Land | Improvement |
|---|---|---|---|---|
| 2025 | $2,005 | $180,694 | $64,531 | $116,163 |
| 2023 | $2,005 | $173,679 | $62,026 | $111,653 |
| 2022 | $1,960 | $170,274 | $60,810 | $109,464 |
| 2021 | $1,947 | $166,936 | $59,618 | $107,318 |
| 2020 | $1,932 | $165,225 | $59,007 | $106,218 |
| 2019 | $1,897 | $161,986 | $57,850 | $104,136 |
| 2018 | $1,860 | $158,811 | $56,716 | $102,095 |
| 2017 | $1,828 | $155,698 | $55,604 | $100,094 |
| 2016 | $1,714 | $152,646 | $54,514 | $98,132 |
| 2015 | $1,689 | $150,356 | $53,697 | $96,659 |
| 2014 | $1,673 | $147,413 | $52,647 | $94,766 |
Source: Public Records
Map
Nearby Homes
- 7859 Sycamore Ave
- 8205 Janis St
- 3694 Gay Way
- 7703 Cassia Ave
- 3536 Jefferson St
- 4065 Madrona Rd
- 4364 Via San Luis
- 7535 Magnolia Ave
- 3924 Wayne Ct
- 7516 San Juan Ave
- 3921 Heidi Rd
- 6985 Malibu Dr
- 5620 Ensenada Way
- 6848 Holbrook Way
- 4311 Snowberry St
- 3867 Roblyn St
- 8277 Verbena Dr
- 7830 Casa Blanca St
- 4909 El Molino Ave
- 6757 Clifford St
- 3936 Via San Jose
- 3916 Via San Jose
- 3919 Canterbury Rd
- 3927 Canterbury Rd
- 3946 Via San Jose
- 3906 Via San Jose
- 3923 Canterbury Rd
- 3907 Canterbury Rd
- 3925 Via San Jose
- 3915 Via San Jose
- 3935 Via San Jose
- 3956 Via San Jose
- 3931 Canterbury Rd
- 3945 Via San Jose
- 3905 Via San Jose
- 3897 Canterbury Rd
- 3955 Via San Jose
- 8002 Garfield St
- 3926 Lester St
- 3966 Via San Jose