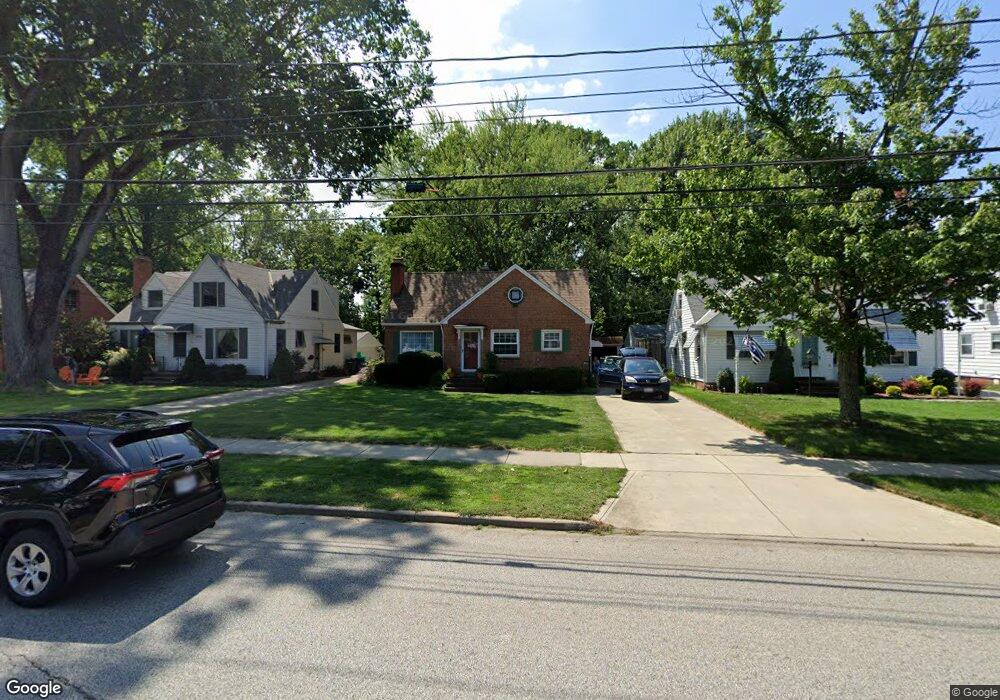
3928 W 210th St Cleveland, OH 44126
Estimated Value: $266,000 - $290,000
3
Beds
1
Bath
1,596
Sq Ft
$174/Sq Ft
Est. Value
About This Home
This home is located at 3928 W 210th St, Cleveland, OH 44126 and is currently estimated at $278,475, approximately $174 per square foot. 3928 W 210th St is a home located in Cuyahoga County with nearby schools including Gilles-Sweet Elementary School, Lewis F Mayer Middle School, and Fairview High School.
Ownership History
Date
Name
Owned For
Owner Type
Purchase Details
Closed on
Mar 27, 2019
Sold by
Fusco Monica J
Bought by
Fusco Monica J
Current Estimated Value
Purchase Details
Closed on
Dec 8, 1997
Sold by
Marquard Michael J
Bought by
Borsody Mark W and Fusco Monica J
Home Financials for this Owner
Home Financials are based on the most recent Mortgage that was taken out on this home.
Original Mortgage
$126,990
Interest Rate
7.46%
Mortgage Type
VA
Purchase Details
Closed on
Aug 28, 1989
Sold by
Nelson David B and Nelson Joan S
Bought by
Marquard Michael J
Purchase Details
Closed on
Oct 3, 1984
Sold by
Schabel Donald J
Bought by
Nelson David B and Nelson Joan S
Purchase Details
Closed on
Mar 23, 1976
Sold by
Simpson Patricia A
Bought by
Schabel Donald J
Purchase Details
Closed on
Jan 1, 1975
Bought by
Simpson Patricia A
Create a Home Valuation Report for This Property
The Home Valuation Report is an in-depth analysis detailing your home's value as well as a comparison with similar homes in the area
Home Values in the Area
Average Home Value in this Area
Purchase History
| Date | Buyer | Sale Price | Title Company |
|---|---|---|---|
| Fusco Monica J | -- | None Available | |
| Borsody Mark W | $124,500 | -- | |
| Marquard Michael J | $81,100 | -- | |
| Nelson David B | $64,500 | -- | |
| Schabel Donald J | -- | -- | |
| Simpson Patricia A | -- | -- |
Source: Public Records
Mortgage History
| Date | Status | Borrower | Loan Amount |
|---|---|---|---|
| Previous Owner | Borsody Mark W | $126,990 |
Source: Public Records
Tax History Compared to Growth
Tax History
| Year | Tax Paid | Tax Assessment Tax Assessment Total Assessment is a certain percentage of the fair market value that is determined by local assessors to be the total taxable value of land and additions on the property. | Land | Improvement |
|---|---|---|---|---|
| 2024 | $5,073 | $73,360 | $16,485 | $56,875 |
| 2023 | $4,996 | $61,960 | $14,040 | $47,920 |
| 2022 | $4,873 | $61,950 | $14,040 | $47,920 |
| 2021 | $4,973 | $61,950 | $14,040 | $47,920 |
| 2020 | $4,574 | $49,950 | $11,310 | $38,640 |
| 2019 | $4,068 | $142,700 | $32,300 | $110,400 |
| 2018 | $3,920 | $49,950 | $11,310 | $38,640 |
| 2017 | $3,949 | $44,810 | $10,120 | $34,690 |
| 2016 | $3,923 | $44,810 | $10,120 | $34,690 |
| 2015 | $3,704 | $44,810 | $10,120 | $34,690 |
| 2014 | $3,704 | $42,670 | $9,630 | $33,040 |
Source: Public Records
Map
Nearby Homes
- 3712 Addington Ct
- 20778 Woodstock Ave
- 21236 Northwood Ave
- 20663 Woodstock Ave
- 3740 W 214th St
- 3420 W 210th St
- 21143 Westwood Rd
- 21237 Westwood Rd
- 3340 W 210th St
- 3733 River Ln
- 21872 Addington Blvd Unit 15
- 4348 W 202nd St
- 4352 W 211th St
- 2888 Pease Dr Unit 110
- 2885 Pease Dr Unit 106
- 20187 Grannis Rd
- 20877 Fairpark Dr
- 4036 W 219th St
- 3167 Linden Rd Unit 503
- 3167 Linden Rd Unit 309
- 3936 W 210th St
- 3920 W 210th St
- 3944 W 210th St
- 3910 W 210th St
- 3950 W 210th St
- 3900 W 210th St
- 3925 W 210th St
- 3929 W 210th St
- 3960 W 210th St
- 3894 W 210th St
- 3945 W 210th St
- 3909 W 210th St
- 3953 W 210th St
- 3901 W 210th St
- 3970 W 210th St
- 20968 Belvidere Ave
- 3927 Circlewood Dr
- 3893 W 210th St
- 3935 Circlewood Dr
- 3919 Circlewood Dr