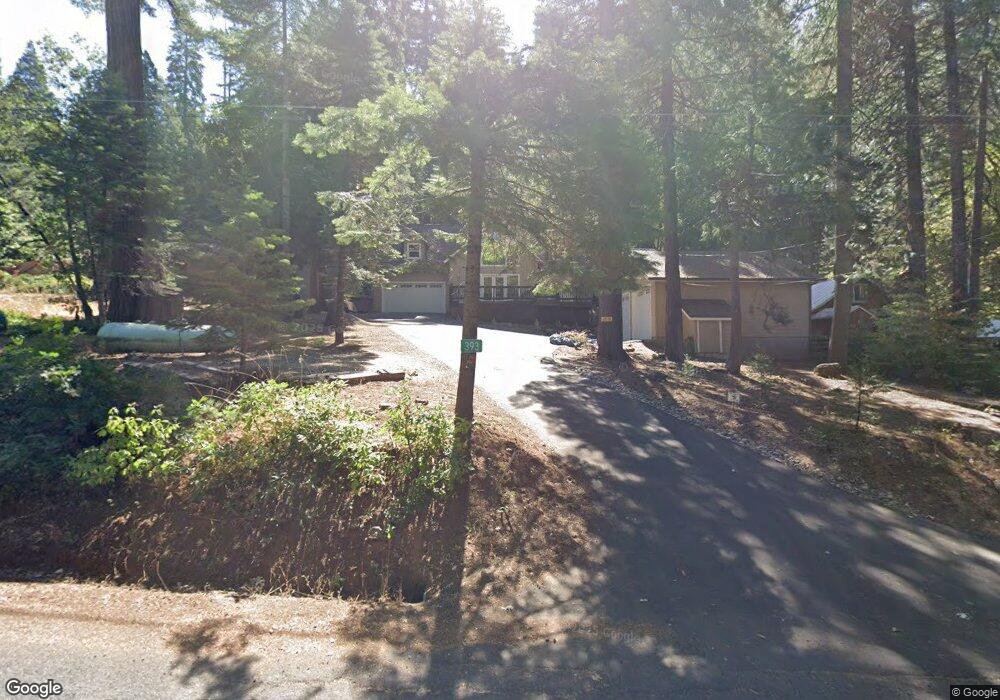
393 Arnold Byway Arnold, CA 95223
Estimated Value: $515,000 - $595,269
3
Beds
4
Baths
2,148
Sq Ft
$262/Sq Ft
Est. Value
About This Home
This home is located at 393 Arnold Byway, Arnold, CA 95223 and is currently estimated at $563,067, approximately $262 per square foot. 393 Arnold Byway is a home with nearby schools including Bret Harte Union High School.
Ownership History
Date
Name
Owned For
Owner Type
Purchase Details
Closed on
Aug 14, 2013
Sold by
Williams Steven G and Williams Eileen M
Bought by
Williams Steven G and Williams Eileen M
Current Estimated Value
Purchase Details
Closed on
May 24, 2005
Sold by
Bennington Ramey and Dow Lawrence W
Bought by
Williams Steve G and Williams Eileen M
Home Financials for this Owner
Home Financials are based on the most recent Mortgage that was taken out on this home.
Original Mortgage
$69,375
Outstanding Balance
$36,173
Interest Rate
5.84%
Mortgage Type
Fannie Mae Freddie Mac
Estimated Equity
$526,894
Purchase Details
Closed on
Jul 17, 2001
Sold by
Dow Michaela R
Bought by
Dow Lawrence W
Home Financials for this Owner
Home Financials are based on the most recent Mortgage that was taken out on this home.
Original Mortgage
$9,600
Interest Rate
7.15%
Mortgage Type
Seller Take Back
Create a Home Valuation Report for This Property
The Home Valuation Report is an in-depth analysis detailing your home's value as well as a comparison with similar homes in the area
Home Values in the Area
Average Home Value in this Area
Purchase History
| Date | Buyer | Sale Price | Title Company |
|---|---|---|---|
| Williams Steven G | -- | None Available | |
| Williams Steve G | $92,500 | Calaveras Title Company | |
| Dow Lawrence W | -- | The Sterling Title Co | |
| Bennington Ramey | $12,000 | The Sterling Title Co | |
| Keeland Bonnie M | -- | The Sterling Title Co |
Source: Public Records
Mortgage History
| Date | Status | Borrower | Loan Amount |
|---|---|---|---|
| Open | Williams Steve G | $69,375 | |
| Previous Owner | Bennington Ramey | $9,600 |
Source: Public Records
Tax History
| Year | Tax Paid | Tax Assessment Tax Assessment Total Assessment is a certain percentage of the fair market value that is determined by local assessors to be the total taxable value of land and additions on the property. | Land | Improvement |
|---|---|---|---|---|
| 2025 | $6,395 | $543,420 | $128,929 | $414,491 |
| 2023 | $6,211 | $522,320 | $123,923 | $398,397 |
| 2022 | $5,966 | $512,080 | $121,494 | $390,586 |
| 2021 | $4,908 | $408,000 | $30,000 | $378,000 |
| 2020 | $4,591 | $380,000 | $30,000 | $350,000 |
| 2019 | $4,498 | $369,000 | $30,000 | $339,000 |
| 2018 | $4,335 | $369,000 | $30,000 | $339,000 |
| 2017 | $3,670 | $311,000 | $30,000 | $281,000 |
| 2016 | $3,262 | $269,000 | $20,000 | $249,000 |
| 2015 | -- | $269,000 | $20,000 | $249,000 |
| 2014 | -- | $236,000 | $20,000 | $216,000 |
Source: Public Records
Map
Nearby Homes
- 999 Grizzly Way
- 210 David Lee Rd
- 459 Dean Way
- 845 Honey Ct
- 923 Bear Run Way
- 588 Blue Lake Springs Dr
- 167 Linda Dr
- 485 Moran Rd
- 729 Dawyn Dr
- 791 Highway 4
- 1224 Shannon Way
- 174 Wood Chip Cir
- 1051 Greensboro Way
- 1290 Aspen St
- 1262 Pebble Beach Way
- 1206 Greensboro Way
- 1111 California 4
- 1273 Lilac Dr
- 1002 Manuel Rd
- 1376 Meadow Dr
- 377 Arnold Byway
- 417 Arnold Byway
- 361 Arnold Byway
- 433 California 4
- 628 Arnold Byway
- 644 Arnold Byway
- 0 Arnold Byway Unit 580 & 60
- 433 Arnold Byway
- 341 Arnold Byway
- 350 Arnold Byway
- 701 Arnold Byway
- 320 Arnold Byway
- 507 Arnold Byway
- 511 Arnold Byway
- 299 Arnold Byway
- 517 Arnold Byway
- 533 Arnold Byway
- 1169 Cub Ct
- 1143 Cub Ct
- 394 Russell Dr
Your Personal Tour Guide
Ask me questions while you tour the home.